Fig. 1.
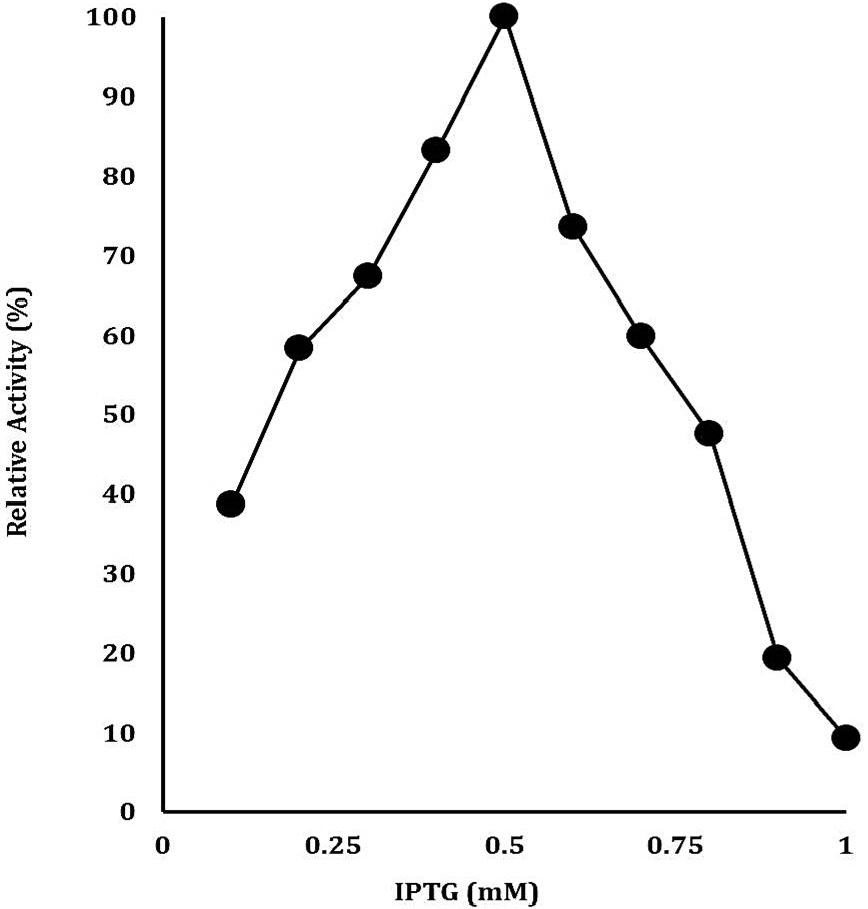
Optimization of IPTG concentration for the maximal production of recombinant cellulase. The data on X-axis shows the IPTG concentration (mM) whereas on Y-axis shows the relative activity (%).
Optimization of IPTG concentration for the maximal production of recombinant cellulase. The data on X-axis shows the IPTG concentration (mM) whereas on Y-axis shows the relative activity (%).