
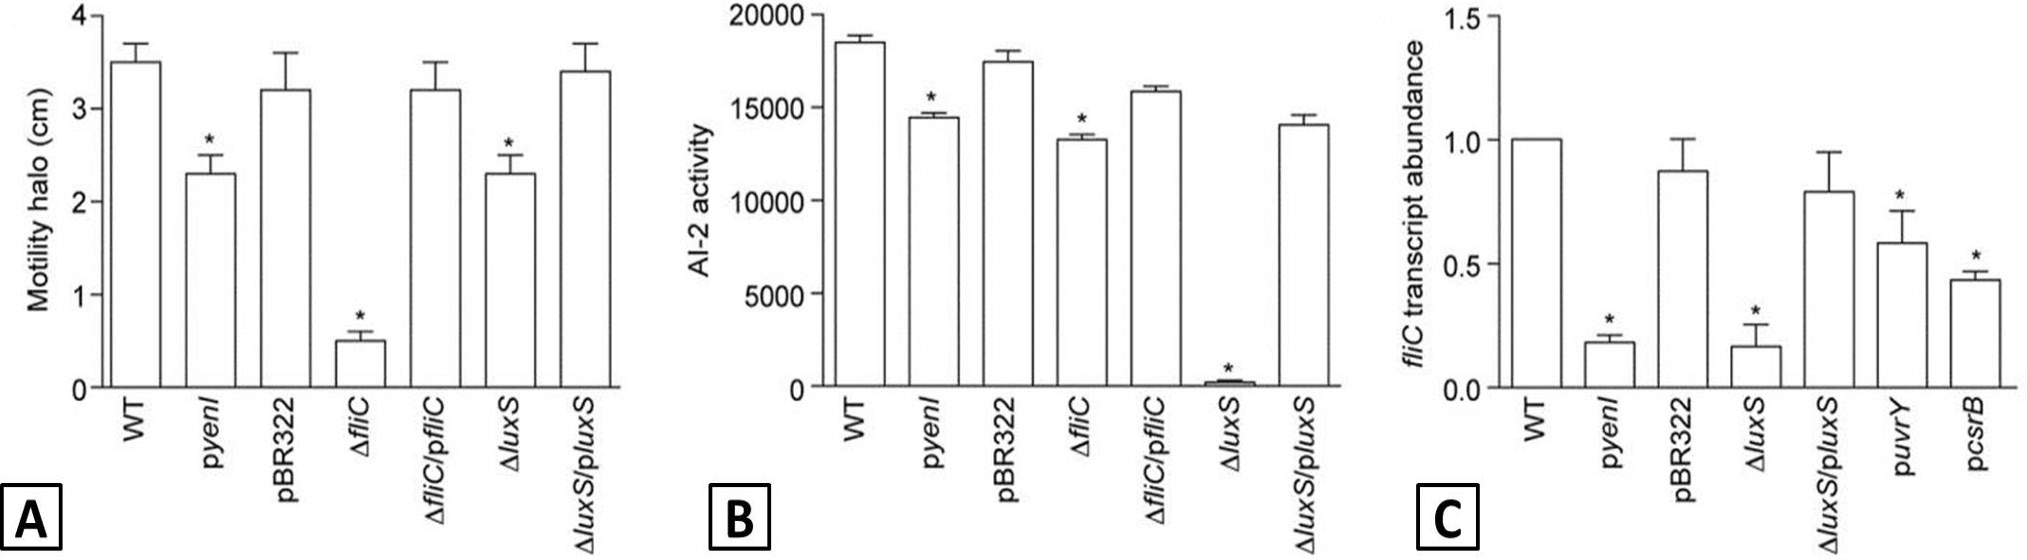
Fig. 1.
QS-1 and QS-II have differential impact on bacterial motility. A, motility diameters were quantified after 12 h growth on 0.3 % swim agar plates; B, AI-2 production, AI-2 activity was measured using a bioluminescence assay after growing the indicated bacterial strains to an OD600 of 1.3. AI-2 activity is expressed as relative light units measured; C, fliC expression. fliC expression was measured using qRT-PCR with data normalized to the endogenous reference gene gapA. Data are expressed relative to expression in the WT strain.