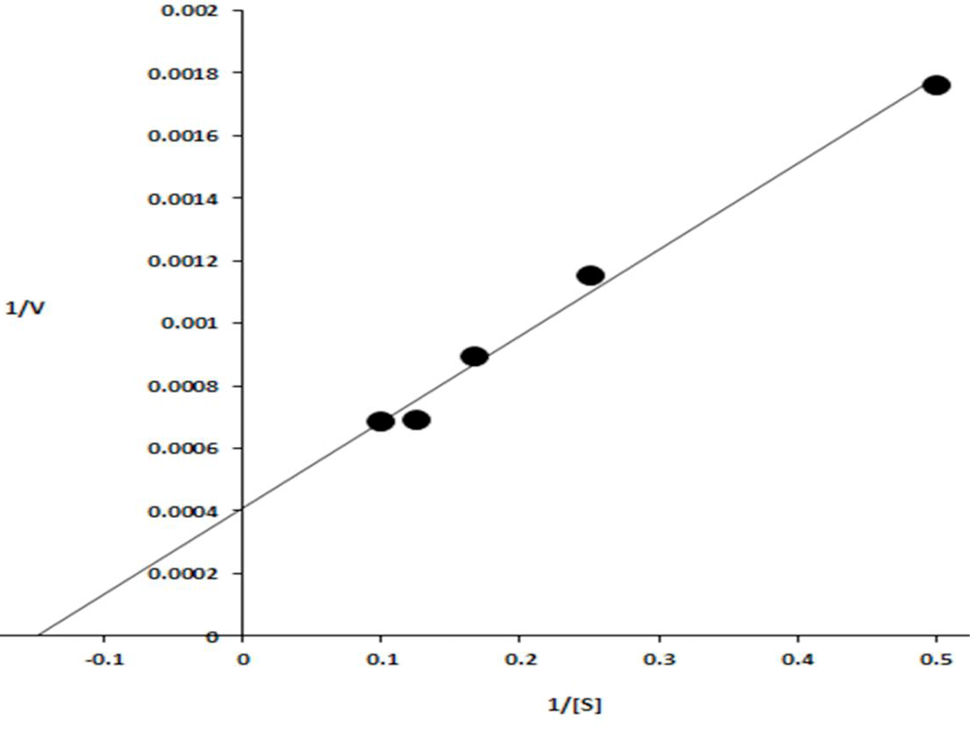
Fig. 5.
Lineweaver–Burk plot obtained by taking the inverse of the substrate concentrations (mg/ml) along X-axis and velocities (μmol min−1 mg-1) along Y-axis.
Lineweaver–Burk plot obtained by taking the inverse of the substrate concentrations (mg/ml) along X-axis and velocities (μmol min−1 mg-1) along Y-axis.