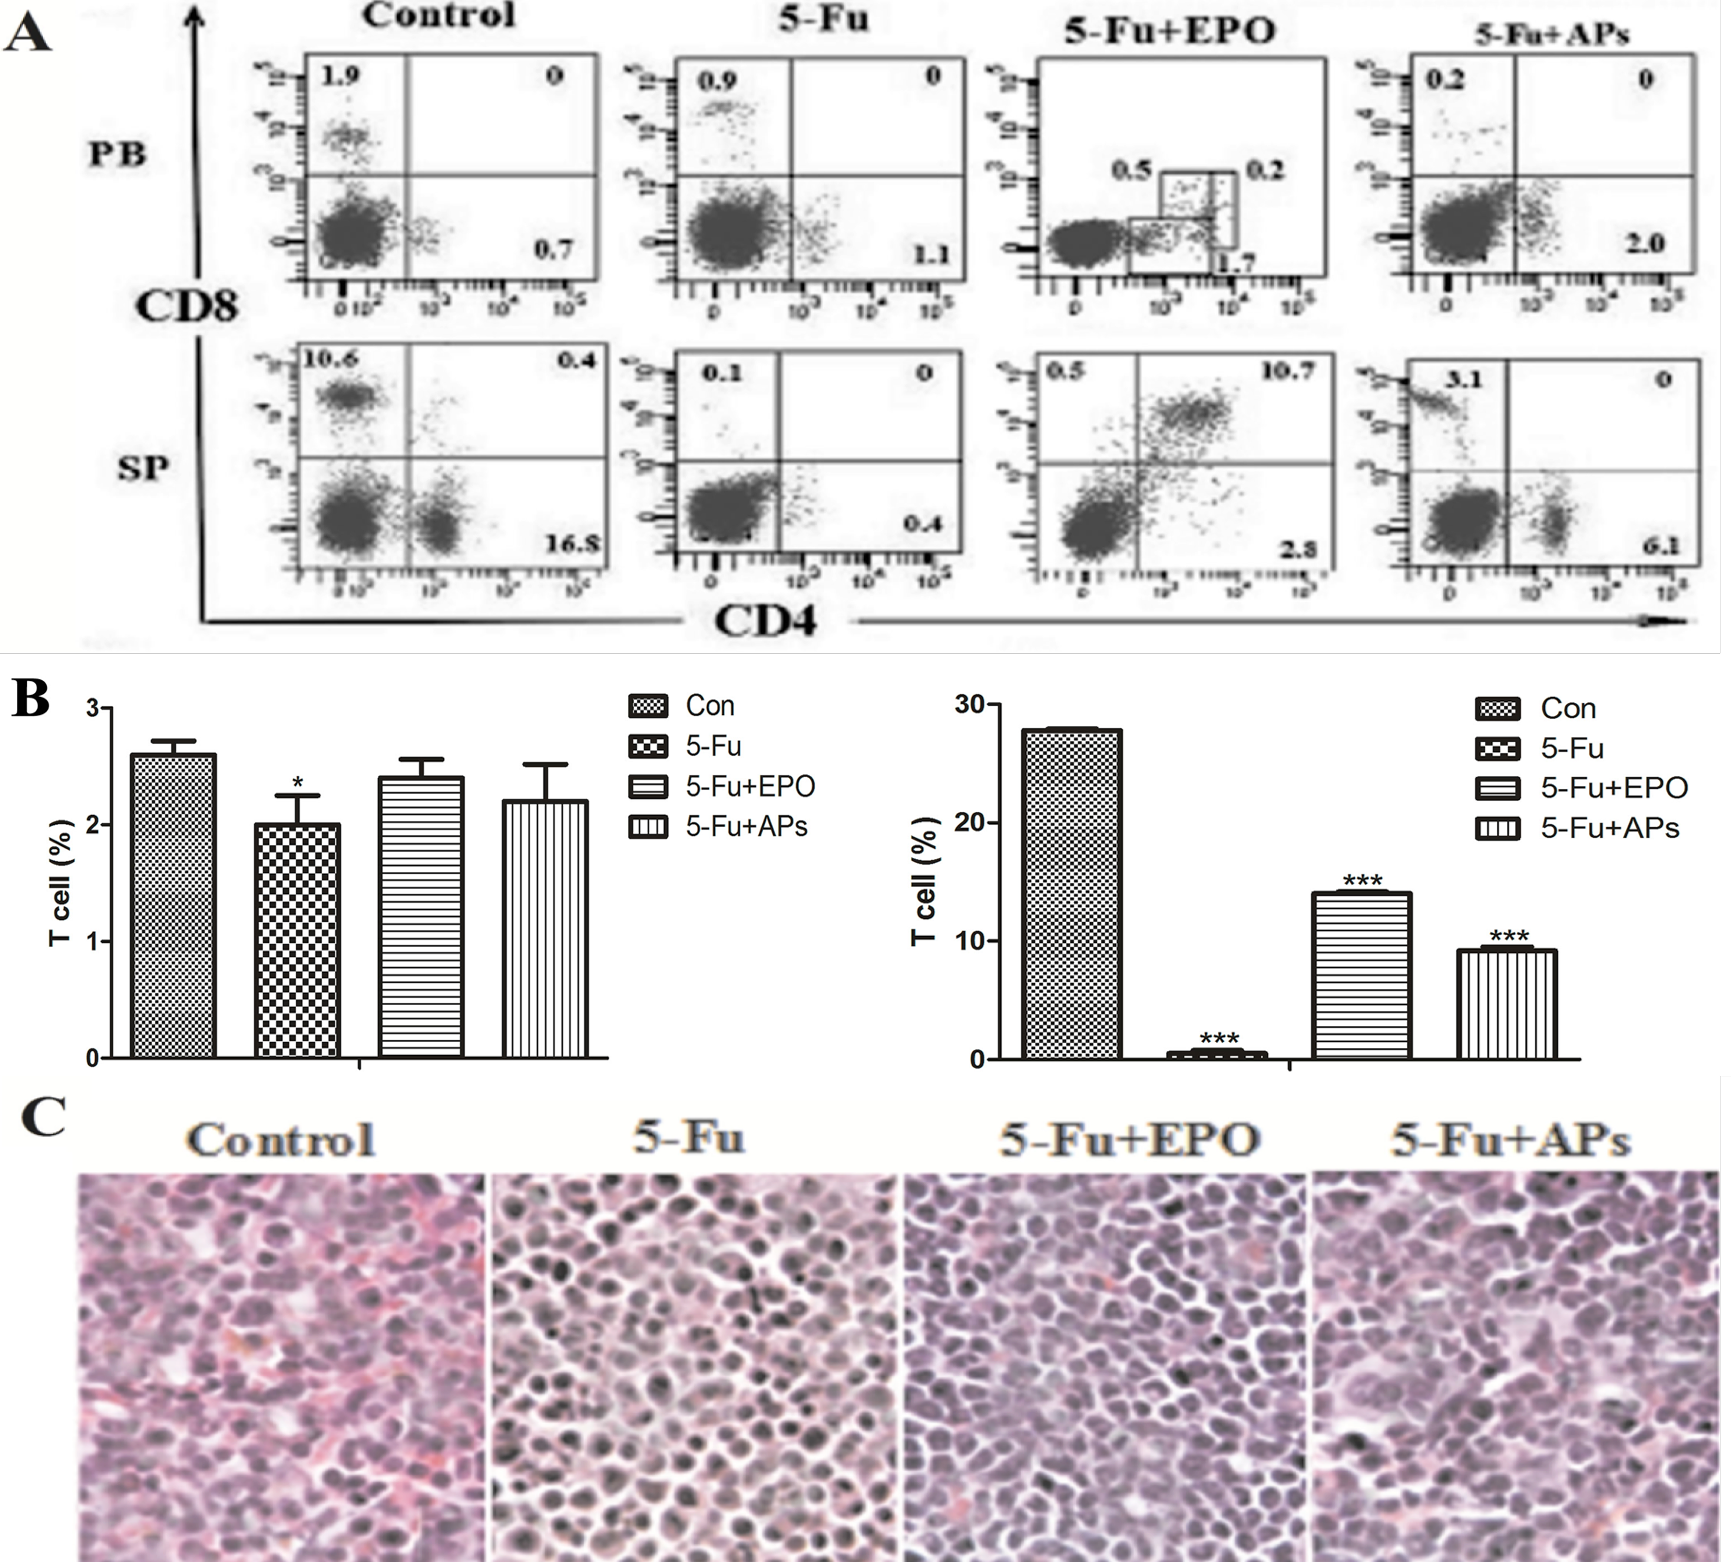
Fig. 3.
CD4/CD8-labeled T cells in control, 5-Fluorouracil (5-Fu), 5-Fu+EPO and 5-Fu+APs groups. (A) Flow cytometric analysis of T cells in the peripheral blood and spleen. CD4 and CD8 are the T cell surface marker protein; (B) Left: statistical analysis of CD4/CD8-labeled T cells in peripheral blood; Right: statistical analysis of CD4/CD8-labeled T cells in spleen. (C) H&E staining of paraffin-embedded sections of spleen for control group, 5-Fu treatment group, 5-Fu +EPO group,and 5-Fu +APs group. Data are presented as the mean ± standard deviation; ***P < 0.001 versus the control group. PB, peripheral blood; SP, spleen.