
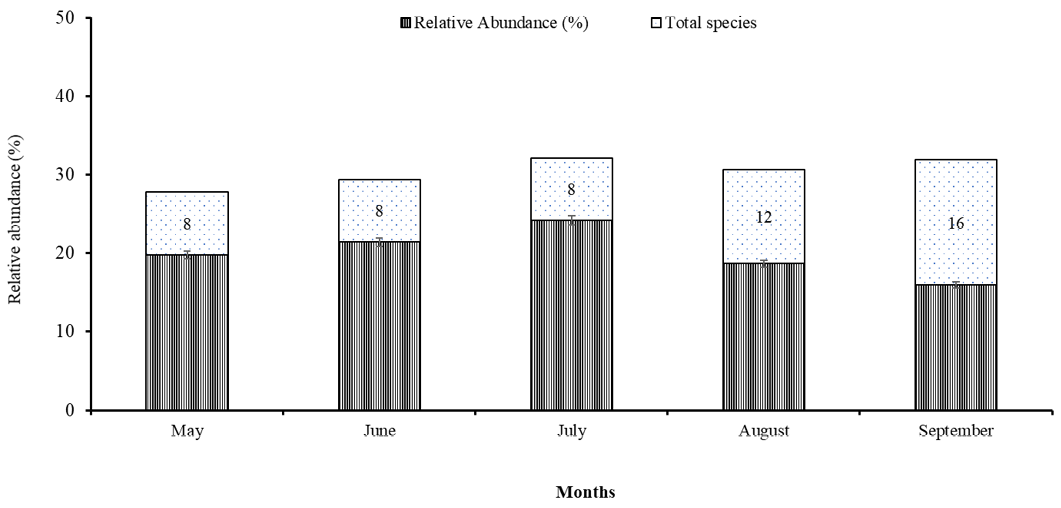
Figure 3:
Relative abundance (%) of the most abundant species (O. excavatus) during different months from the study sites sampled during 2016.
Relative abundance (%) of the most abundant species (O. excavatus) during different months from the study sites sampled during 2016.