
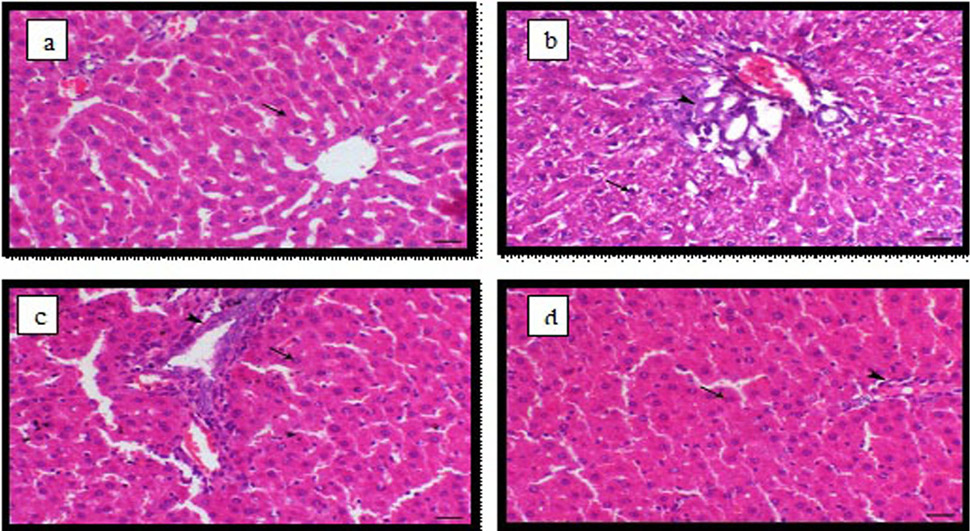
Fig. 4.
Light micrograph of liver, (a) control animals showing normal hepatocytes arranged in cords around the central vein (arrow); (b) PAT-treated animals showing periportal hepatic vacuolation with dark pyknotic nuclei (arrow) and bile duct proliferation (arrowhead); (c) PAT and ginger (4weeks) animal showing normals periportal hepatic cells (arrow) and mild hyperplasia of the lining epithelium of the bile duct (arrowhead) and (d) PAT and ginger animals (8 weeks) showing normal hepatic cells (arrow) and normal portal tissues (arrowhead), Haemotoxylin and Eosin stain, bar = 40 µm.