
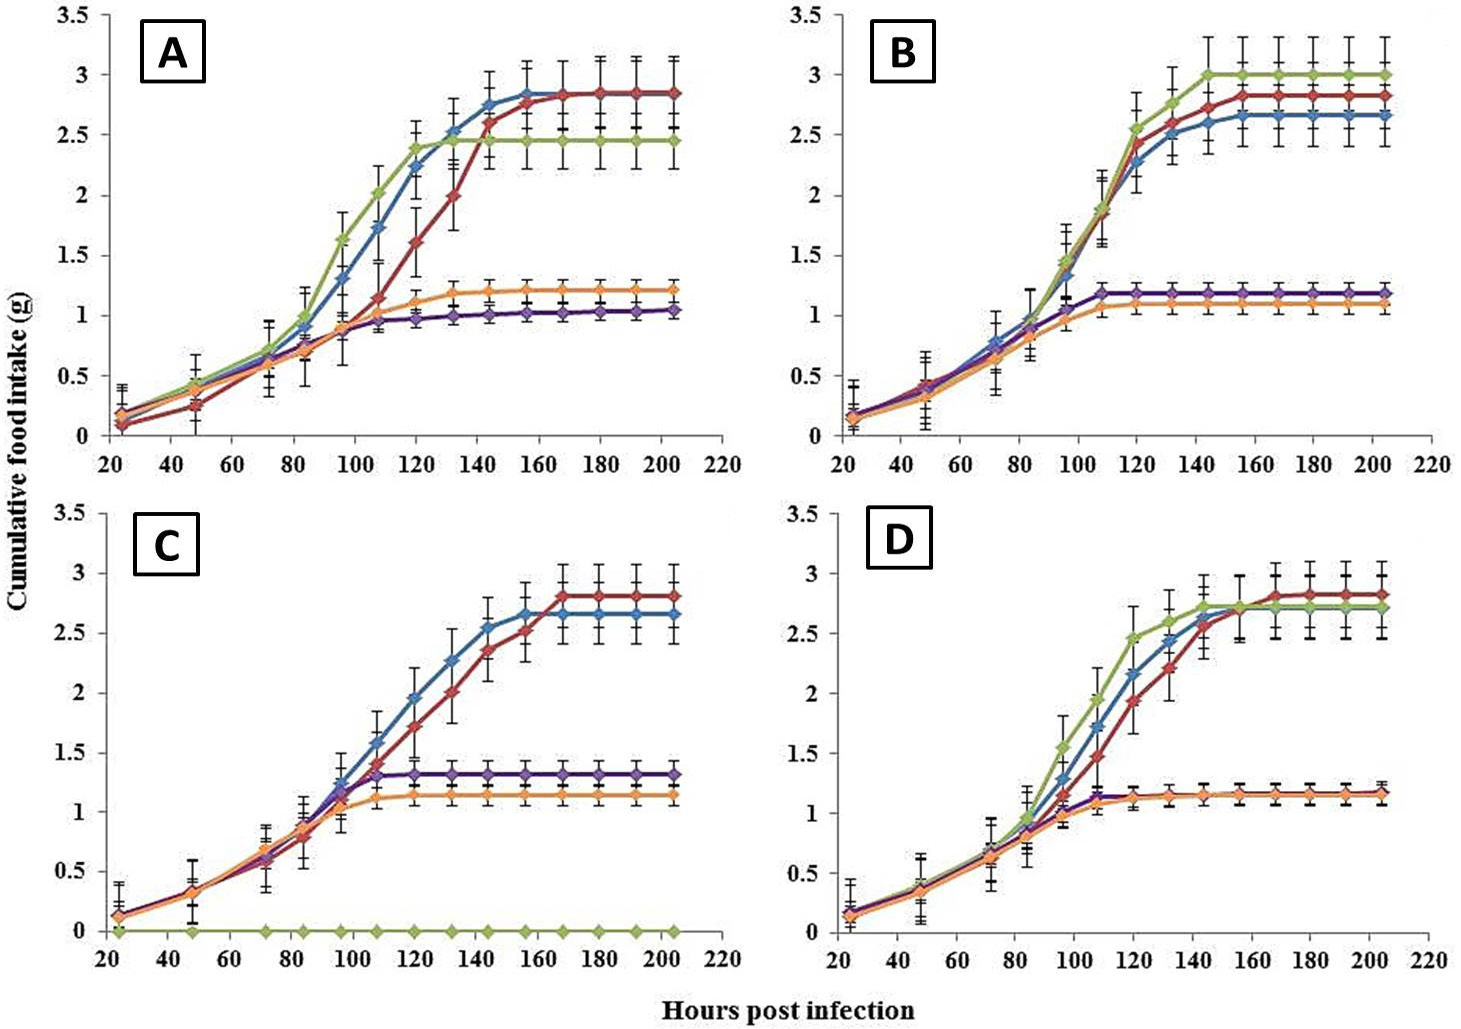
Fig. 1.
Effect of different viral doses (D0=0, D1=104 and D2=105 OBs/larva) on cumulative food consumption of unexposed and exposed infected larvae of S. litura over time. D0-unexposed (control) presented in blue colour, D1-exposed surviving in red colour, D1-exposed infected in purple colour, D2-exposed surviving in green colour and D2-exposed infected in orange colour. The experiment was completed in three replicates. A, replicate 1; B, replicate 2, C, replicate 3; D, replicates combined. The data were pooled in panel d to show the combined effect of replicates. Error bars represent standard error of the mean.