
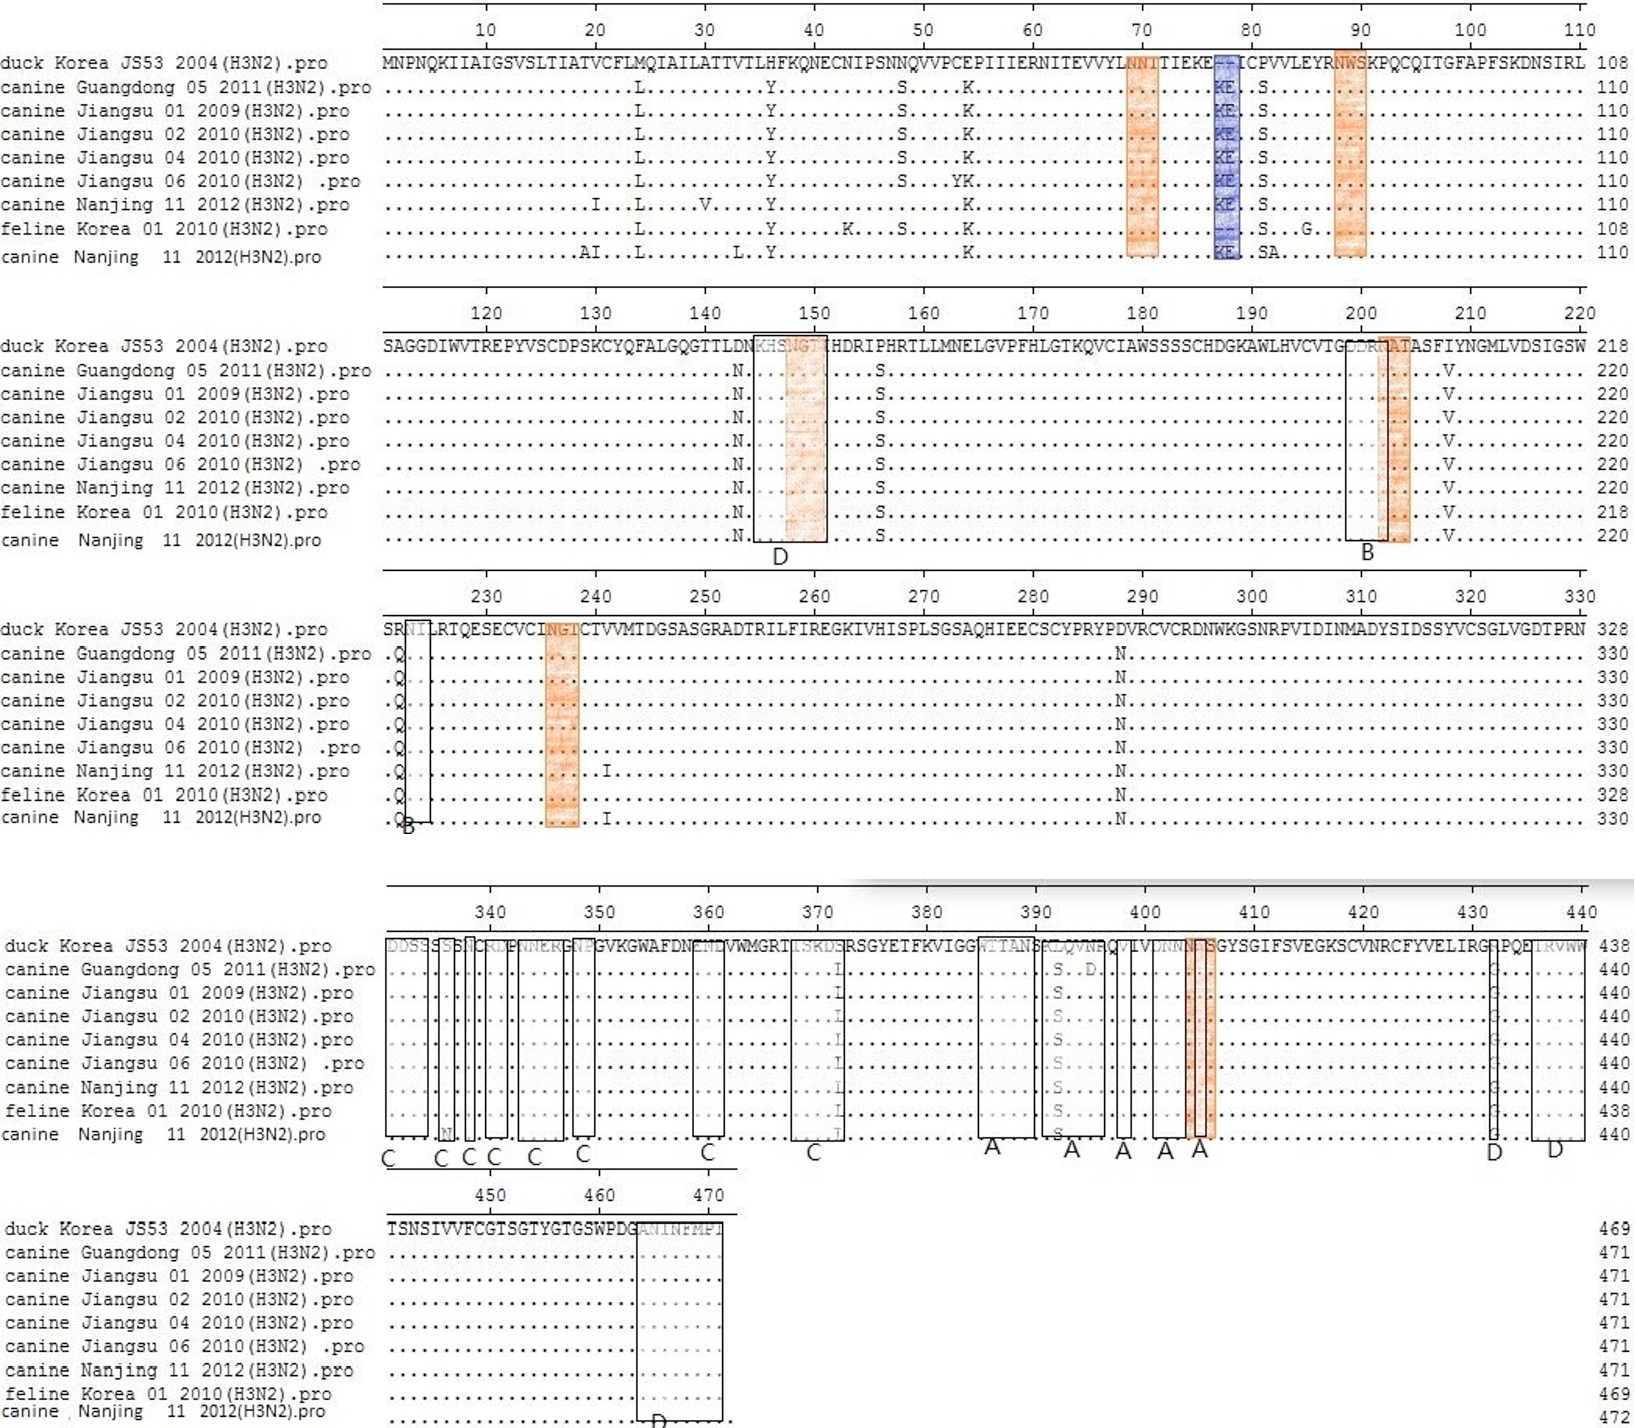
Fig. 6.
Alignment of NA amino acid sequences of H3N2 influenza isolates and the most similar avian isolate. Black boxed residues represent antigenic sites A-E, and orange colored residues denote potential glycosylation sites, blue indicates receptor-binding sites.