
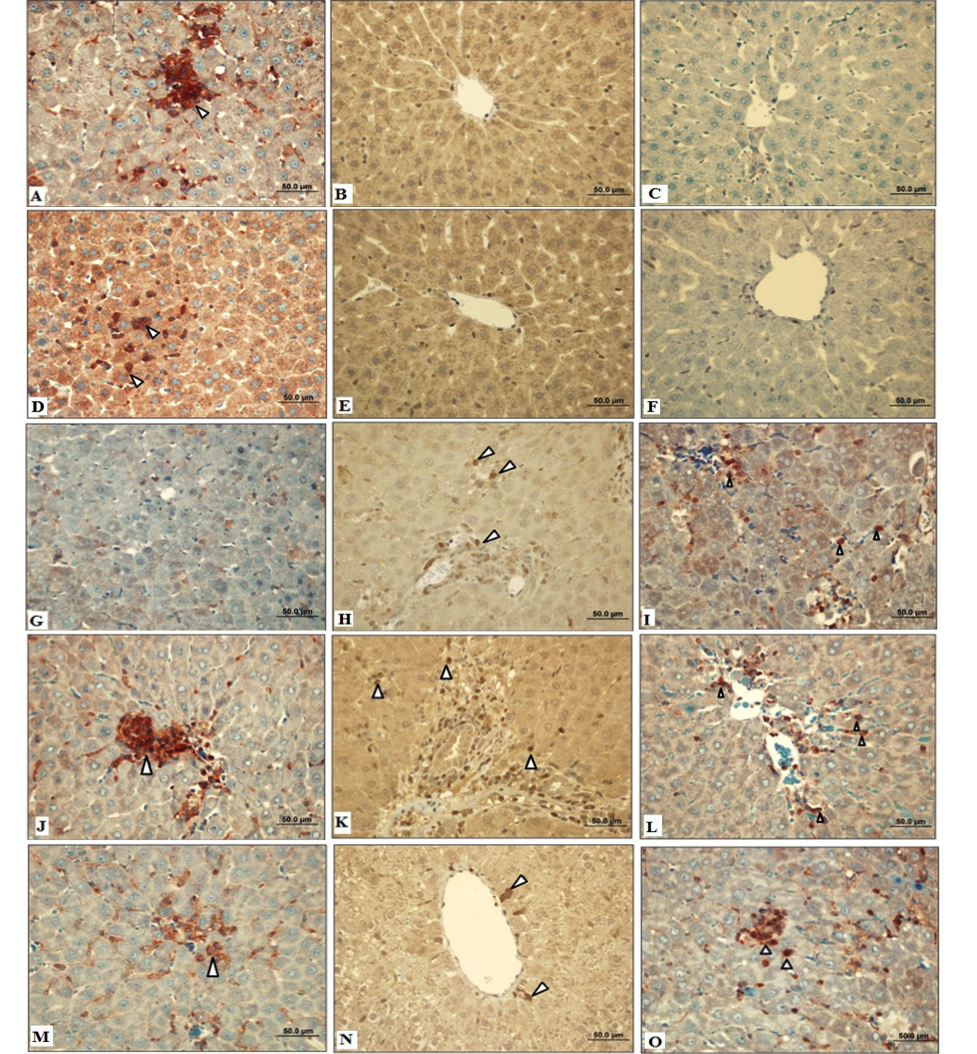
Immunohistochemically-stained liver specimens of the rats in different study groups. Activated caspase-3 and Bax in control group and 0.2 % DMSO-treated showing almost negligible staining normal hepatocytes (B, C, E and F) while Bcl-2 protein expression in control group showing less intense staining normal hepatocyte as shown by arrows (A and D). Caspase-3 and Bax protein expression in D-GaIN-treated group showing more intense staining of hepatocytes and diffused staining as shown by the arrows (H and I) while Activated Bcl-2 in D-GaIN-treated group showing almost negligible staining normal hepatocytes as shown (G). Activated Caspase-3 and Bax immunostaining of liver treated with EA before D-GaIN and D-GaIN before EA showing less intense staining of hepatocytes as shown by arrows (K, L, N and O) while Bcl-2 protein expression in EA before D-GaIN and D-GaIN before EA groups showing less intense staining of hepatocytes as shown by arrow (J and M) (bar: 50µm).