
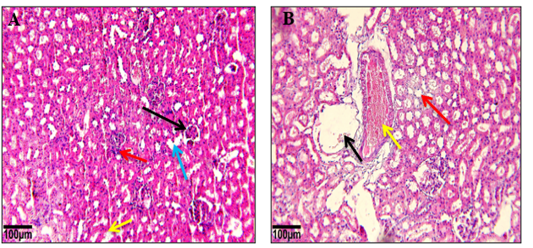
Figure 5A, B
Photomicrograph of rat kidney of 20 gm group showing, (A): glomerulus damage (black arrow), necrosis (blue arrow), dilation of the renal tubules (yellow arrow), lymphocytic infiltration (red arrow), (B): congestion (yellow arrow), hemorrhage (black arrow), fatty changes (red arrow) stained with H&E, Scale bar=100 µm.