
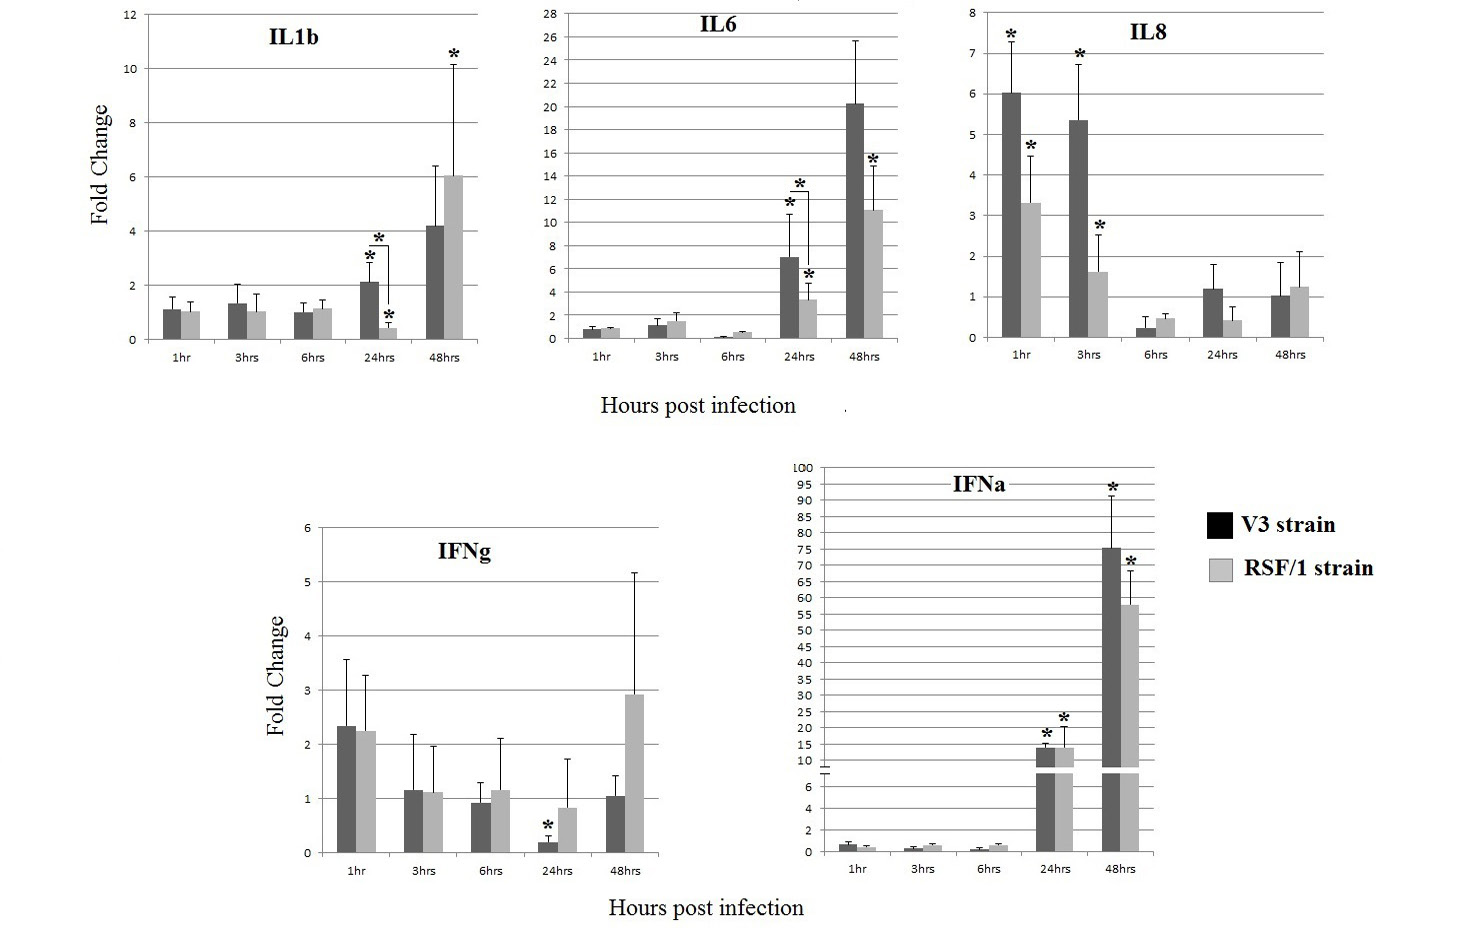
Figure 3
Cytokines gene relative expression in PBMCs cell culture infected with V3 strain (black column) and RSF/1 strain (gray column): *P < 0.05, asterisk over error bar represent significant difference between infected and non-infected cells. While asterisk over horizontal line represent significant difference between both strains. Data showed are the mean with error bar calculated from three replicates at each time point