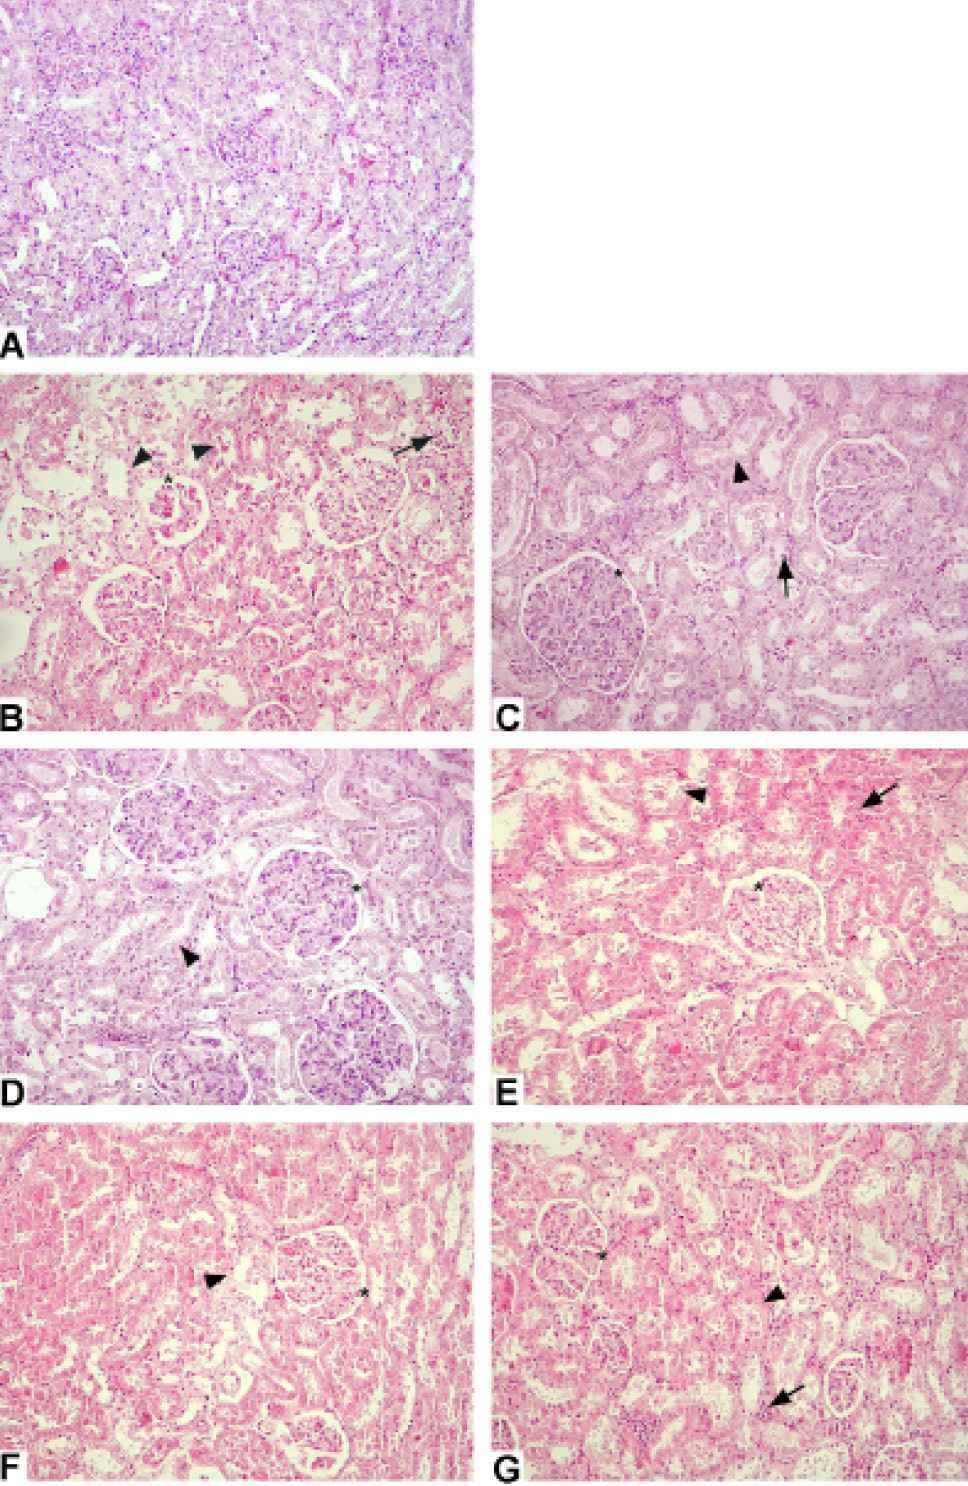
Fig. 4.
Representative photomicrographs of kidney in experimental groups. Normal morphology of kidney (A) in control group (A); degenerated glomerulus (*) and tubular structures (arrowhead) and inflammatory cells (arrow) in CRF group (B); quite regular glomerulus (*), a few degenerated tubular structures (arrowhead) and decreased number of inflammatory cells (arrow) in CRF+CAP (C), CRF+VAL (D), CRF+NAC (E), CRF+CAP+NAC (F) and CRF+VAL+NAC (G) groups are seen. H andE staining, Original magnifications: 200x.