View larger version:
Download Original File
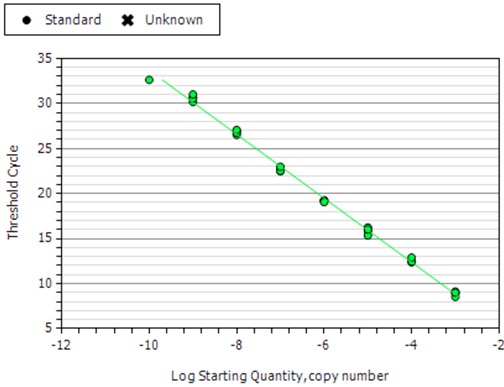
Fig. 1.
Real-time fluorescence quantitative PCR standard curve chart of BPI gene and β-actin.
