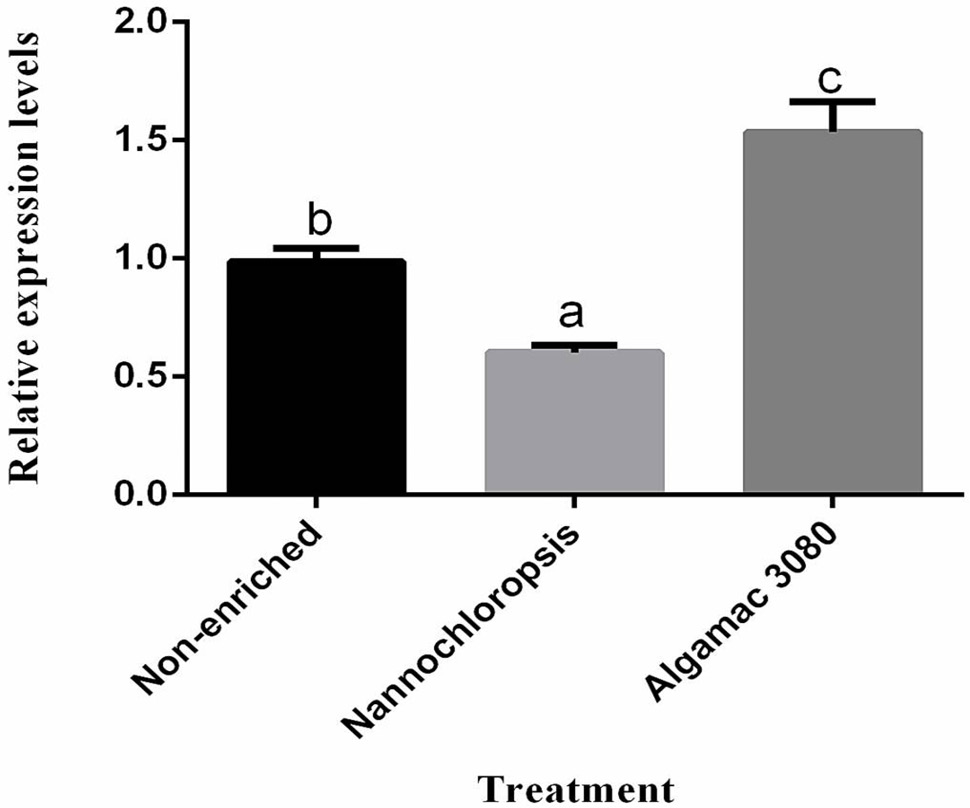
Fig. 8.
Relative expression levels of L-FABP gene of T. ovatus under enriched instant microalgal paste (Nannochloropsis), Algamac3080 and non-enriched. Each Bar represent the mean ± SD (n=3). Different lowercase letters indicate statistically significant differences (P<0.05).