
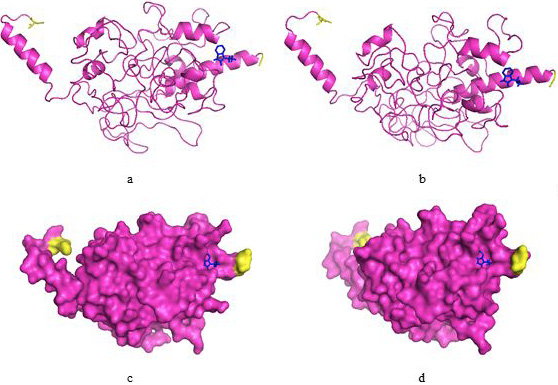
Fig. 4.
3D model of HCV3a E2 protein inferred through I-TASSER and COACH results. (a, b) Ribbon structure of E2 protein showing binding site residues in blue ball and stick. -NH2 and -COOH terminals are shown by yellow color; (c, d) Surface structure of E2 protein displaying two views.