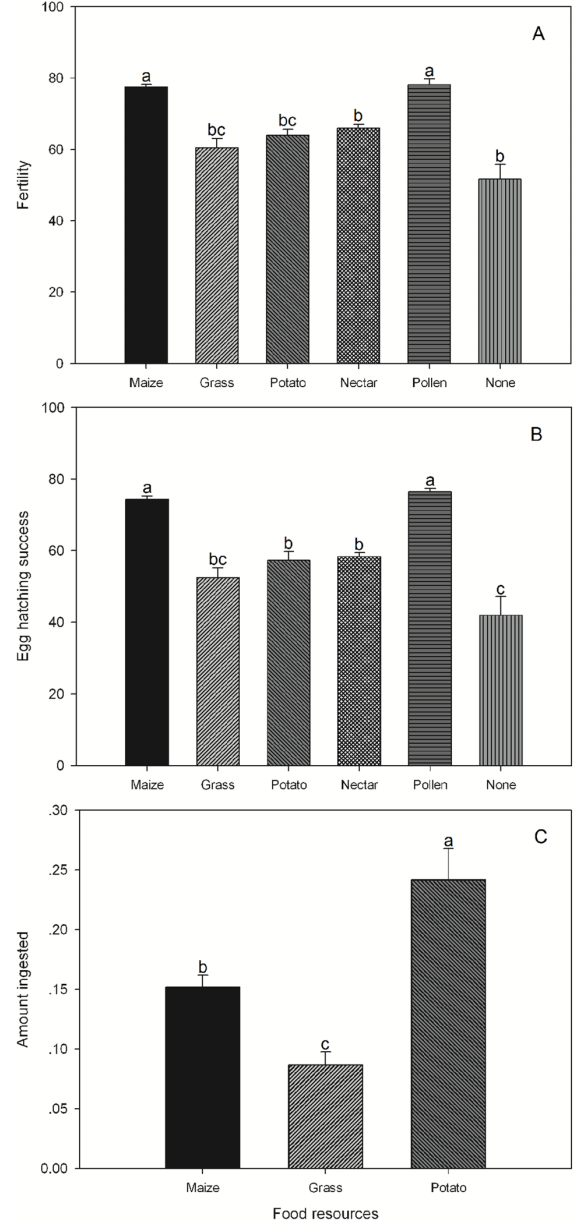
Fig. 2.
A, Reproductive quantity of A. fuscicollis after consuming different foods. The mean±SEM is shown; n=3. Bars with identical letters are not significantly different; B, Number of eggs hatching on different food sources. The mean±SEM is shown; n=3. Bars with identical letters are not significantly different; C, Amount of A. fuscicollis feeding after larvae consumed different foods. The mean±SEM is shown; and n=3. Bars with identical letters are not significantly different.