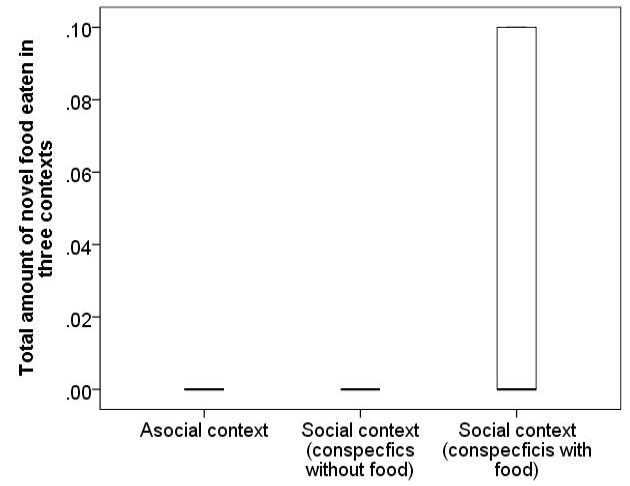
A box and whisker plot of the median and inter quartile range (IQRs) of total amount of novel food eaten.
