
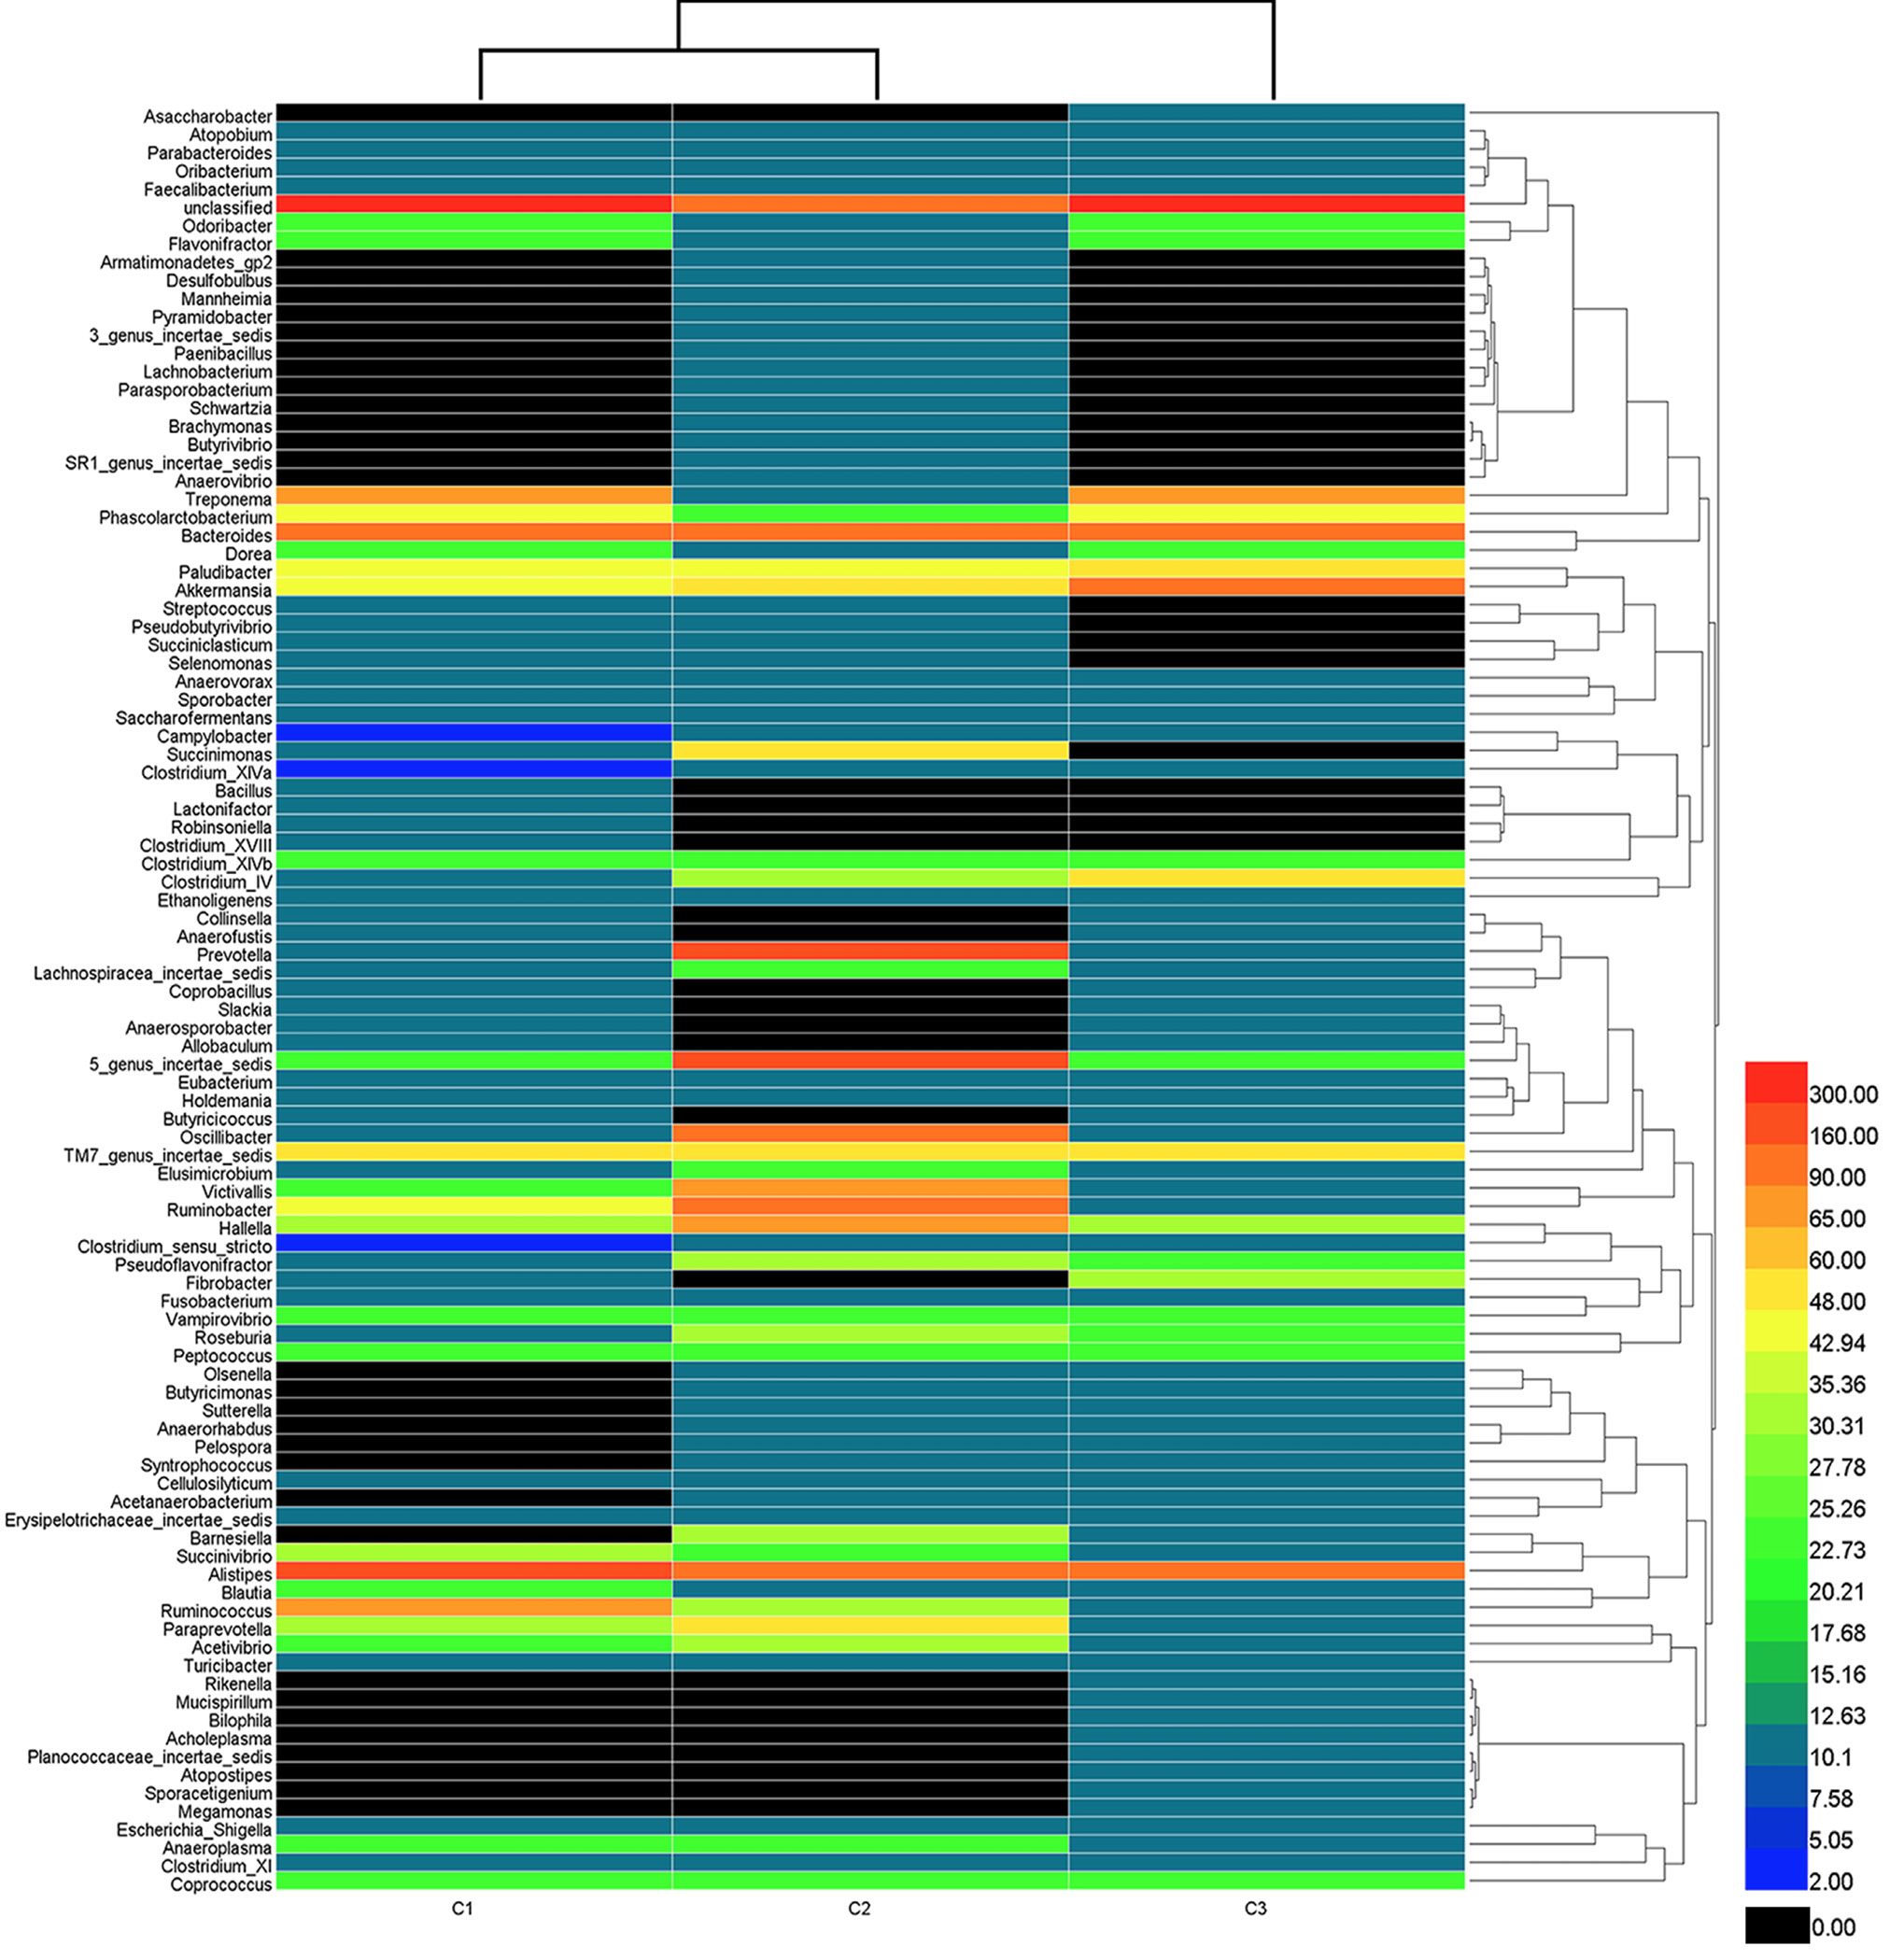
Bacterial distribution among the three samples. Dendrogram showing the bacterial distribution among the three samples. The bacterial phylogenetic tree was calculated using the neighbor-joining method. The relationship among samples was determined by the Bray distance and the complete clustering method. Total genera were sorted for the analysis after each value (the abundance of total bacteria) was multiplied by ten thousand. The heat map plot depicts the percentage of each bacteria (variables clustering on the Y-axis) within each sample (X-axis clustering). The relative values for bacterial genus are depicted by color intensity with the legend indicated at the right of the figure. Clusters based on the distance of the three samples along the X-axis and the bacterial genera along the Y-axis are indicated in the lower and right parts of the figure, respectively. Black represents the result of no bacteria being found.