
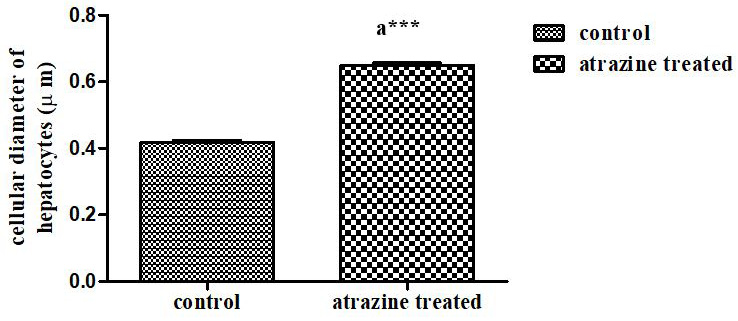
Figure 8:
Cellular diameter of hepatocytes in the liver of Cnt and ATZ treated albino mice. Data represented as mean of 10 mice ±SE, a = Cnt vs ATZ treated group, ***p ˂ 0.001.
Cellular diameter of hepatocytes in the liver of Cnt and ATZ treated albino mice. Data represented as mean of 10 mice ±SE, a = Cnt vs ATZ treated group, ***p ˂ 0.001.