Figure 12
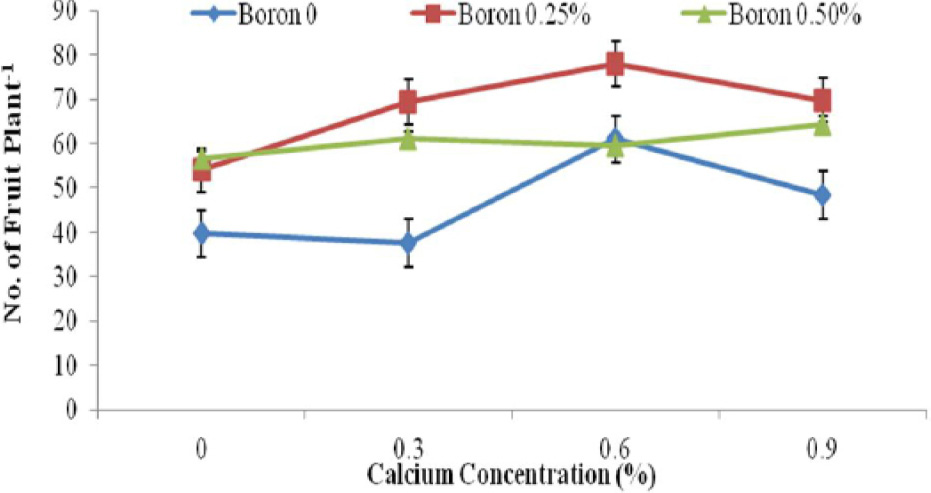
The interaction of Ca and B application on the number of fruits plant-1 of tomato. The vertical bars represent standard error.
The interaction of Ca and B application on the number of fruits plant-1 of tomato. The vertical bars represent standard error.