
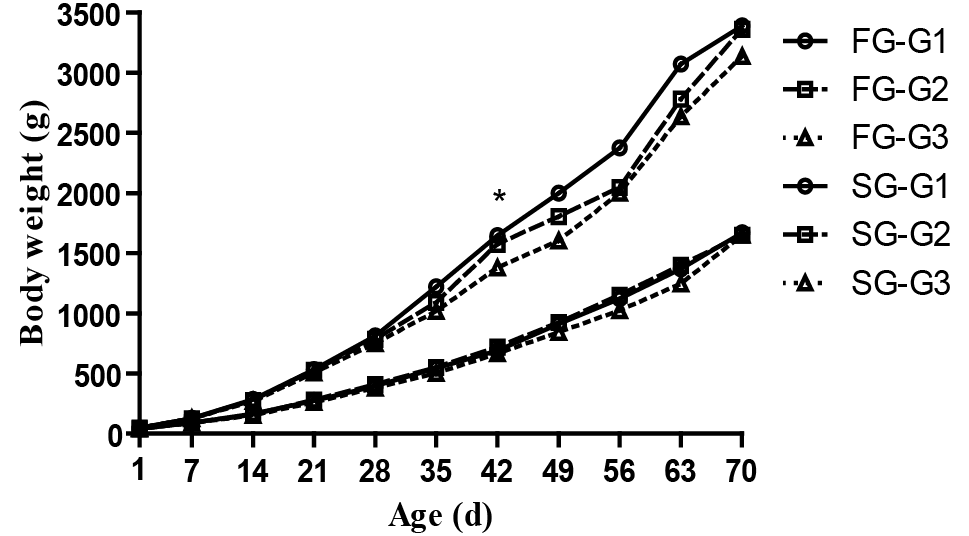
Fig. 2.
Body weights (Mean ±SE) of two stocks with different levels of feed restriction from d 1 to 70. FG and SG represent faster- and slower-growing stocks, respectively. G1, G2, and G3 represent broilers fed with diet amount of 100%, 90%, and 80%, respectively. When significant, differences between FG and SG chickens are marked as * (p < 0.05).