
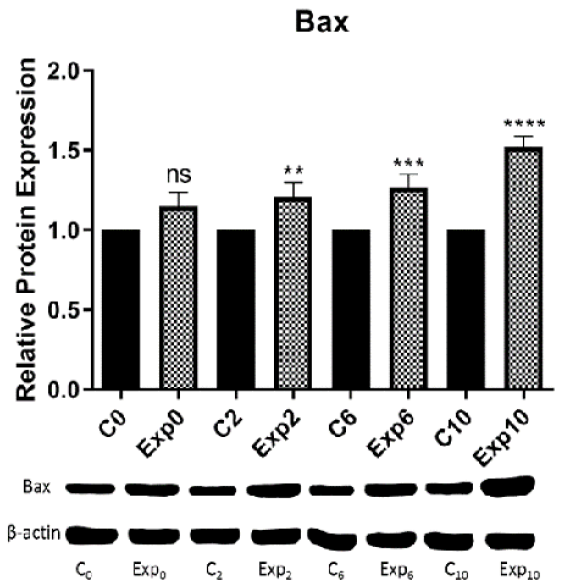
Fig. 3.
Protein expression of Bax in chicken’s erythrocytes at different time intervals of 0, 2, 6 and 10 h (Protein bands derived from Western blot). Data represent mean±SEM. Asterisks (*) indicating significant differences compared to control groups (*p < 0.05; **p < 0.01; ***p < 0.0004; ****p < 0.0001; ns, not significant) C, control; EXP, experimental.