
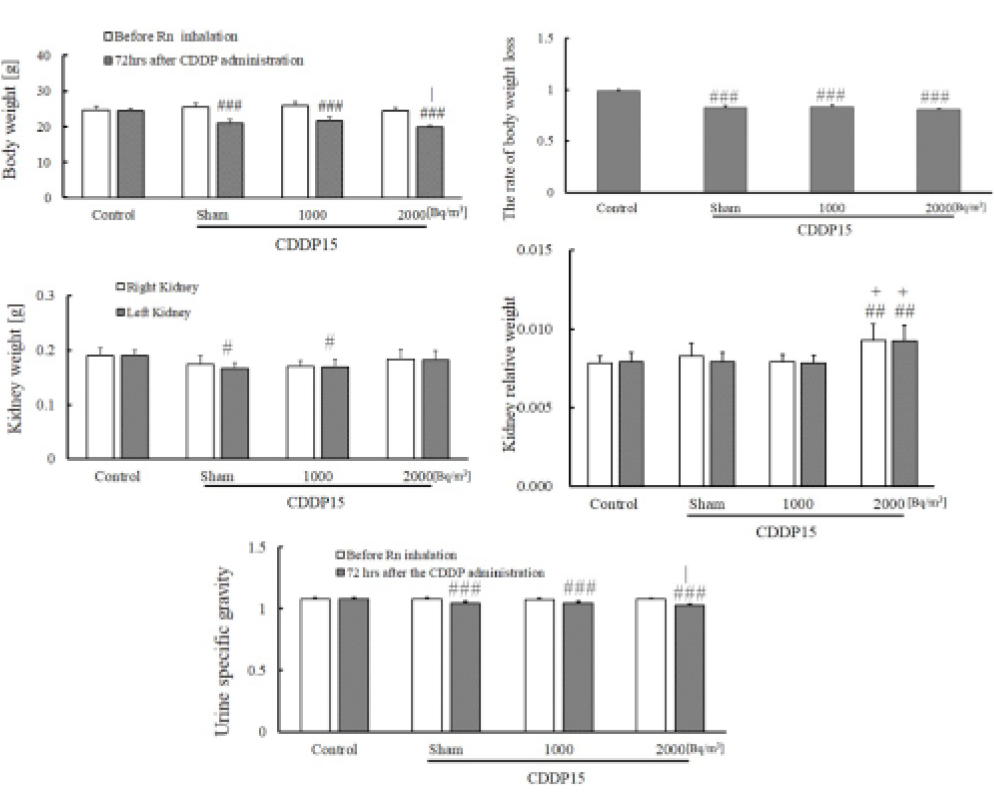
Fig. 5.
Effects of radon inhalation on the 15 mg/kg CDDP-induced renal injury clinical signs, body weight, the rate of body weight loss, absolute and relative kidney weight, and urine specific gravity in BALB/c mice. #P < 0.05, ##P < 0.01, and ###P < 0.001 indicate the radon inhalation groups vs. the control. |P < 0.05 indicates the data at 72 h after CDDP administration with 2000 Bq/m3 radon inhalation vs. the sham (15 mg/kg CDDP only with air inhalation). +P < 0.05 indicates CDDP administration after 2000 Bq/m3 radon inhalation vs. the sham.