
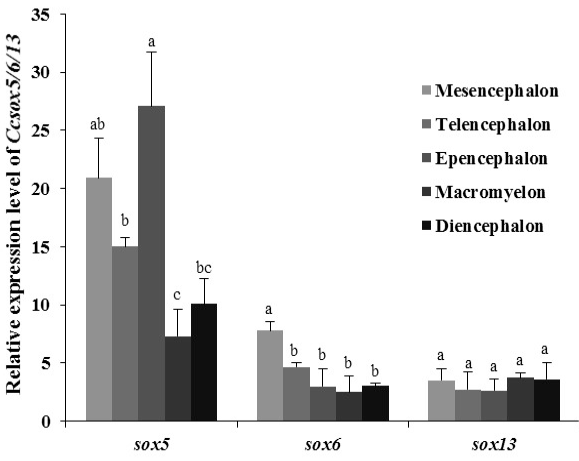
Fig. 7.
Relative expression of CcSox5, CcSox6 and CcSox13 genes in different parts of the adult brain by qRT-PCR analysis. Error bars represent the mean ± SEM (n=6). Significant differences (p < 0.05) exist between any two samples labeled with different single letter.