Figure 7
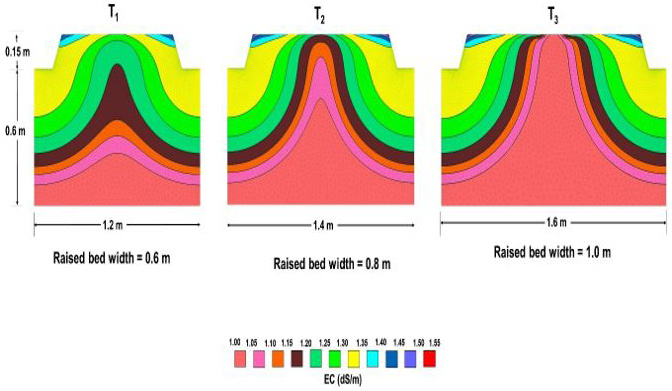
Simulated salt distribution [EC (dS/m) patterns in soil profile down to 0.75 m under treatments T1, T2 and T3 at the end of the experiment.
Simulated salt distribution [EC (dS/m) patterns in soil profile down to 0.75 m under treatments T1, T2 and T3 at the end of the experiment.