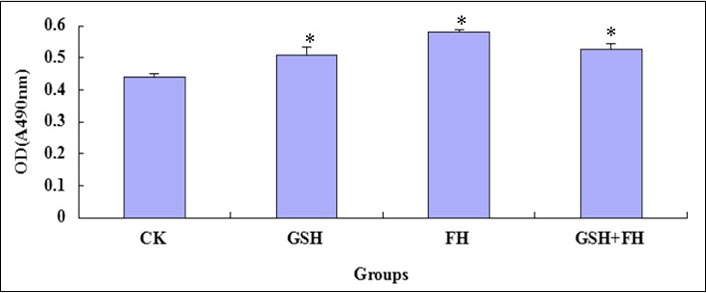
Fig 3
Values of MTT of post-thawed ADSCs treated with GSH and FH. Data are shown as mean values ± SD (n=3). *p<0.05 compared with the control. Control (CK), GSH (100 µM GSH group), FH (10 µM FH group) and GSH + FH (100 µM GSH+10 μM FH group).