
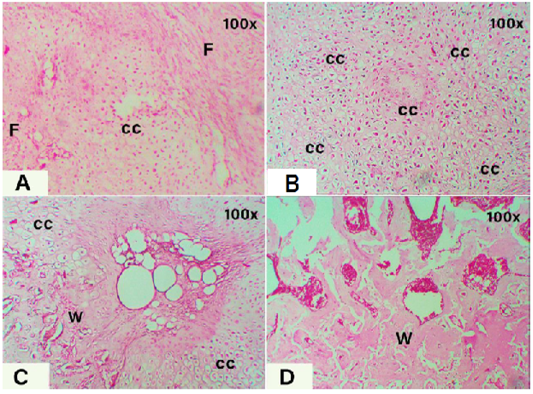
Figure 2
Sections of fractured tibial bone tissues at 21 days post-treatments. A. control group, showing the formation of fibrocartilage tissue by chondrocyte cells (cc) in between the fibrous tissue (F) which was developed earlier; B. Micro-CHA group showing the complete formation of fibrocartilage tissue (Fc) indicates the late phase of soft callus formation; C. Micro-CHA+PRP group, showing the domination of fibrocartilage tissue and the formation of a small proportion of woven bone tissue (W) indicating a hard callus formation; D. Nano-CHA+PRP group, showing the formation of new bone matrix in the fractured area indicated by the domination of woven bone and fusion into lamellar bone. H&E staining, 100x magnification.