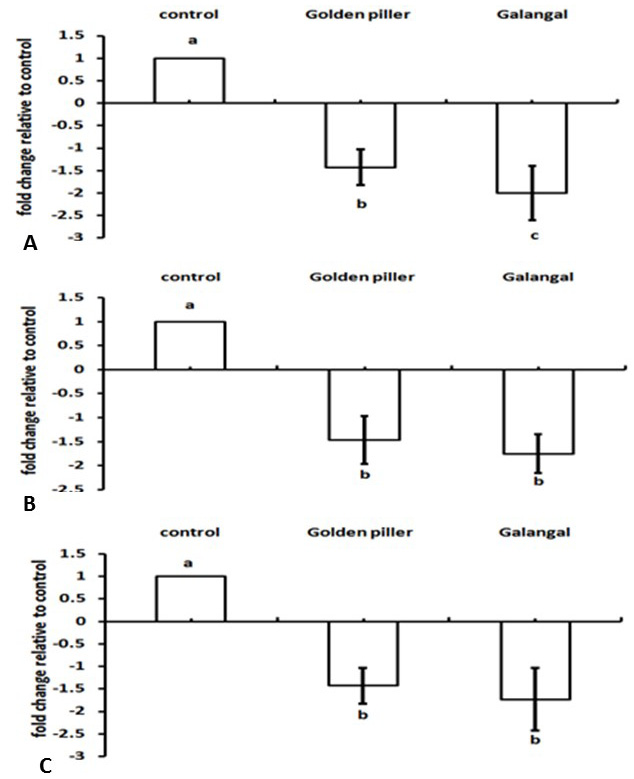
Fig. 1.
Transcript levels after normalization with Actin gene as an endogenous control 72 h post treatment. (A) SFch-1 mRNA, (B) SFch-2 mRNA, (C) SFbtl mRNA. Mean ± SEM of three replications are shown. Means with the different letters are significantly different (p= 0.05; ANOVA; with Tukey Kramer Multiple Comparison).