
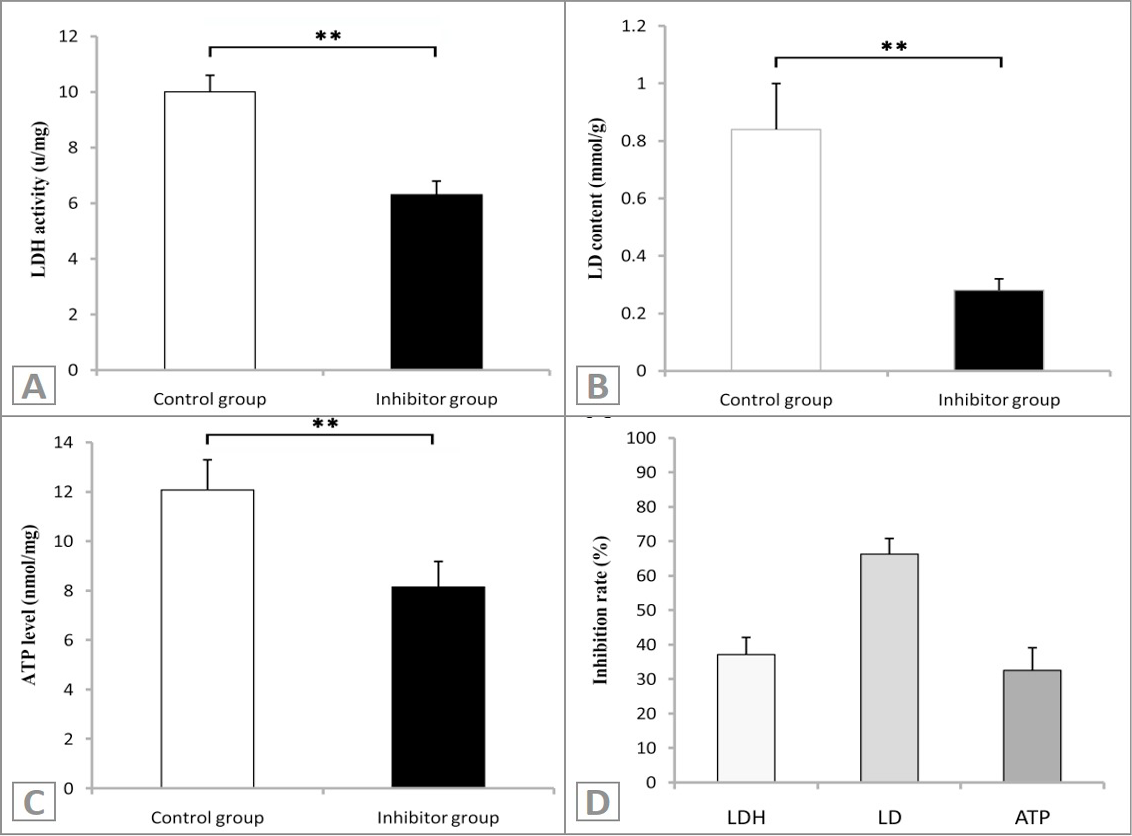
Fig 4
Comparison of LDH, LD, ATP and their inhibition rates of plateau pika skeletal muscle with treatment. A, LDH activities in the skeletal muscle of plateau pika with treatment; B, LD contents in the skeletal muscle of plateau pika with treatment; C, ATP levels in the skeletal muscle of plateau pika with treatment; D, Inhibition rates of LDH, LD and ATP in the skeletal muscle with treatment. All data were expressed as mean±SD; sample size was 8 for each group. **p<0.01.