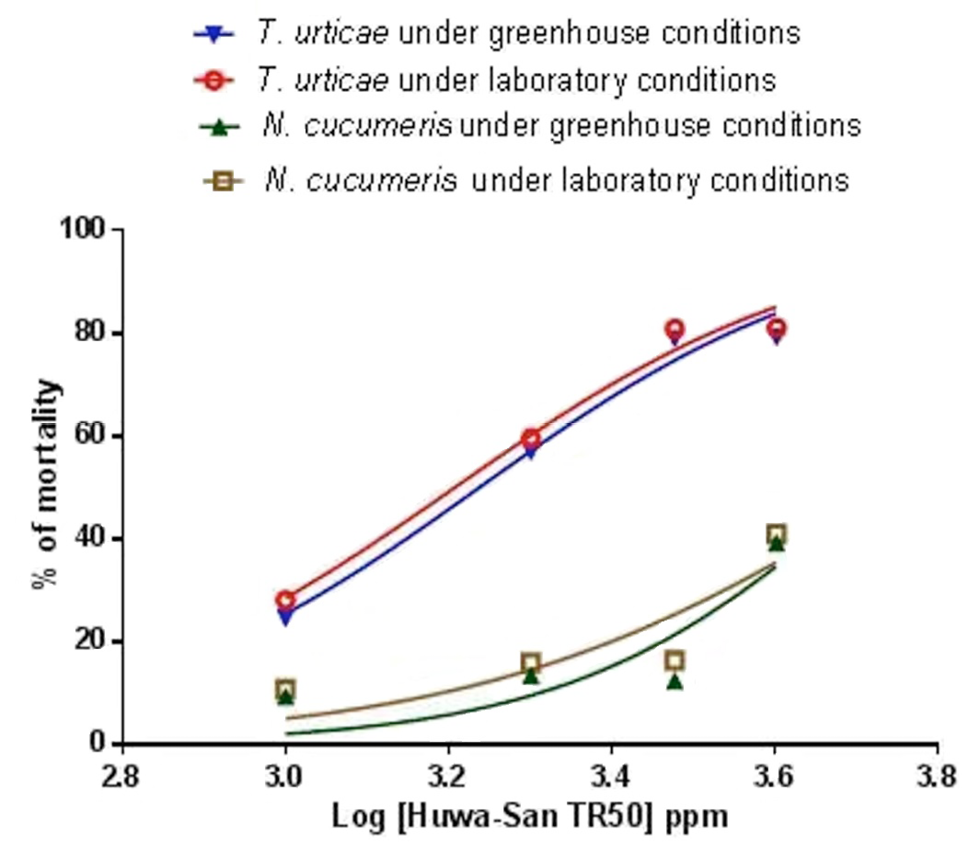
Fig. 1.
Comparison of the average effects of Huwa-San TR50 on the mortality of two spotted spider mite, (T. urticae Koch) and the predatory mite (N. cucumeris Oudemans) after one week of exposure, expressed as a percentage of the control mortality in well water. Each point is the mean ± SEM of 4 replicates, but in most cases, the error bars are smaller than the symbols used. The lines were fitted using a non-linear regression (log (inhibitor) vs. normalized response- variable slope) in Graphpad Prism 7 with the maximum plateau being 100% and the minimum being 0%. The IC50 values are listed in Table III.