View larger version:
Download Original File
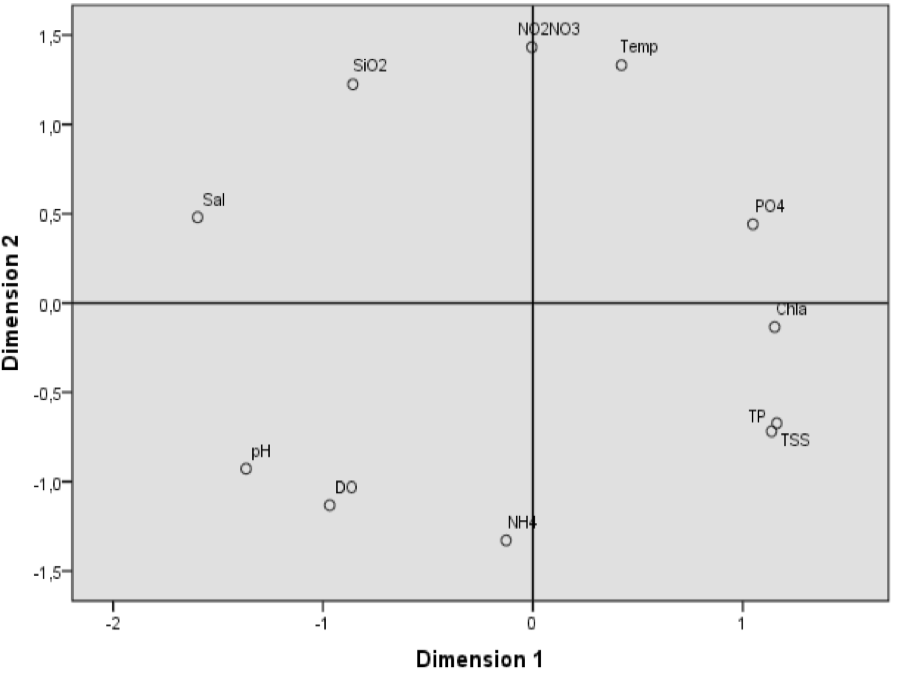
Fig. 3.
MDS plot of water quality variables and inorganic nutrients in study area