View larger version:
Download Original File
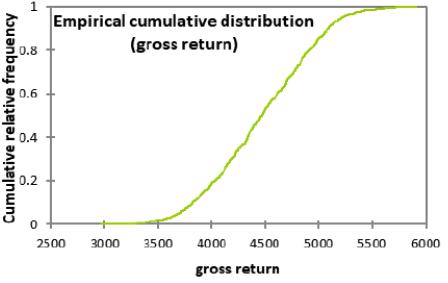
Figure 2:
Distribution of simulated gross return.