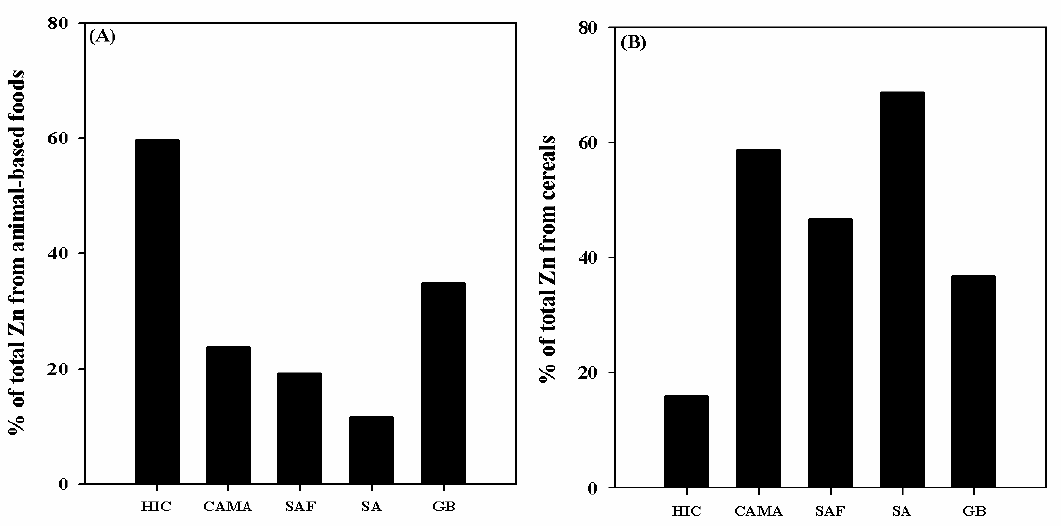
Figure 2:
The % contribution in daily Zn intake from and animal (A) and cereals (B) foods in different regions. HIC: High income countries, CAMA: Central Asia and Middle east, SAF: Sub-Saharan Africa, SA: South Asia, GB: Global. Redrawn and modified from (Wessells and Brown, 2012; Cakmak and Kutman, 2018).