
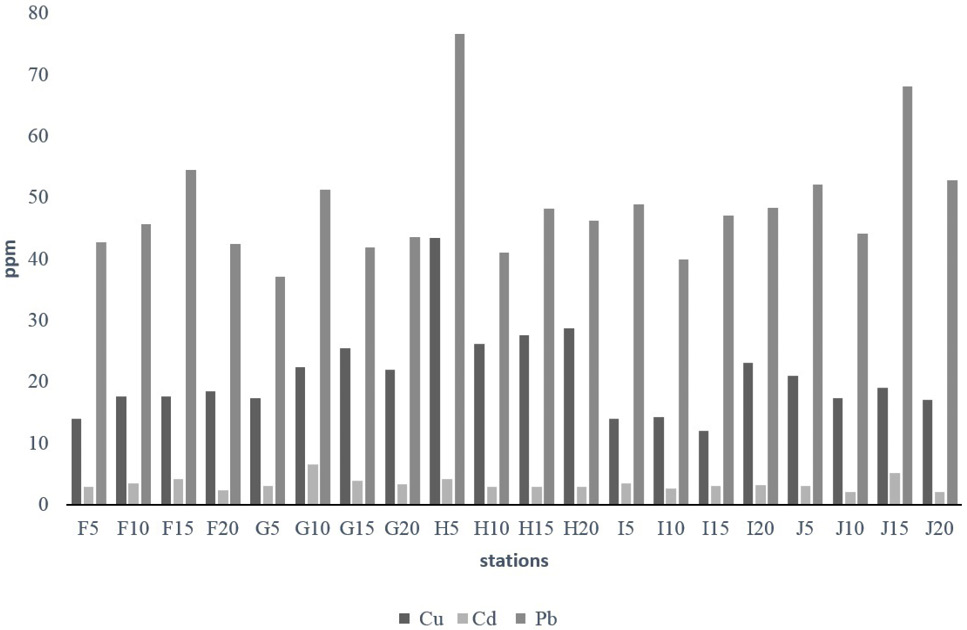
Fig. 2.
Mean concentration of lead, cupper and cadmium along the Gilan costline. Subdivisions stands for different depths in each station (the acronyms are as in Fig. 1).
Mean concentration of lead, cupper and cadmium along the Gilan costline. Subdivisions stands for different depths in each station (the acronyms are as in Fig. 1).