Figure 3
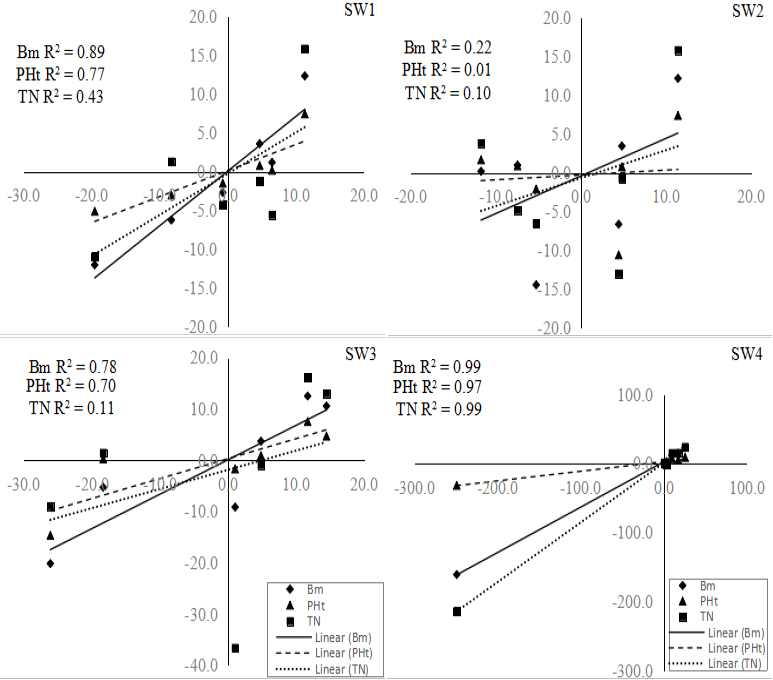
Mean variations in grain yield (x-axis) and the corresponding deviations in biomass (Bm), plant height (PHt) and tiller (TN) (y-axis) over years across sowing windows (SW1-4).
Mean variations in grain yield (x-axis) and the corresponding deviations in biomass (Bm), plant height (PHt) and tiller (TN) (y-axis) over years across sowing windows (SW1-4).