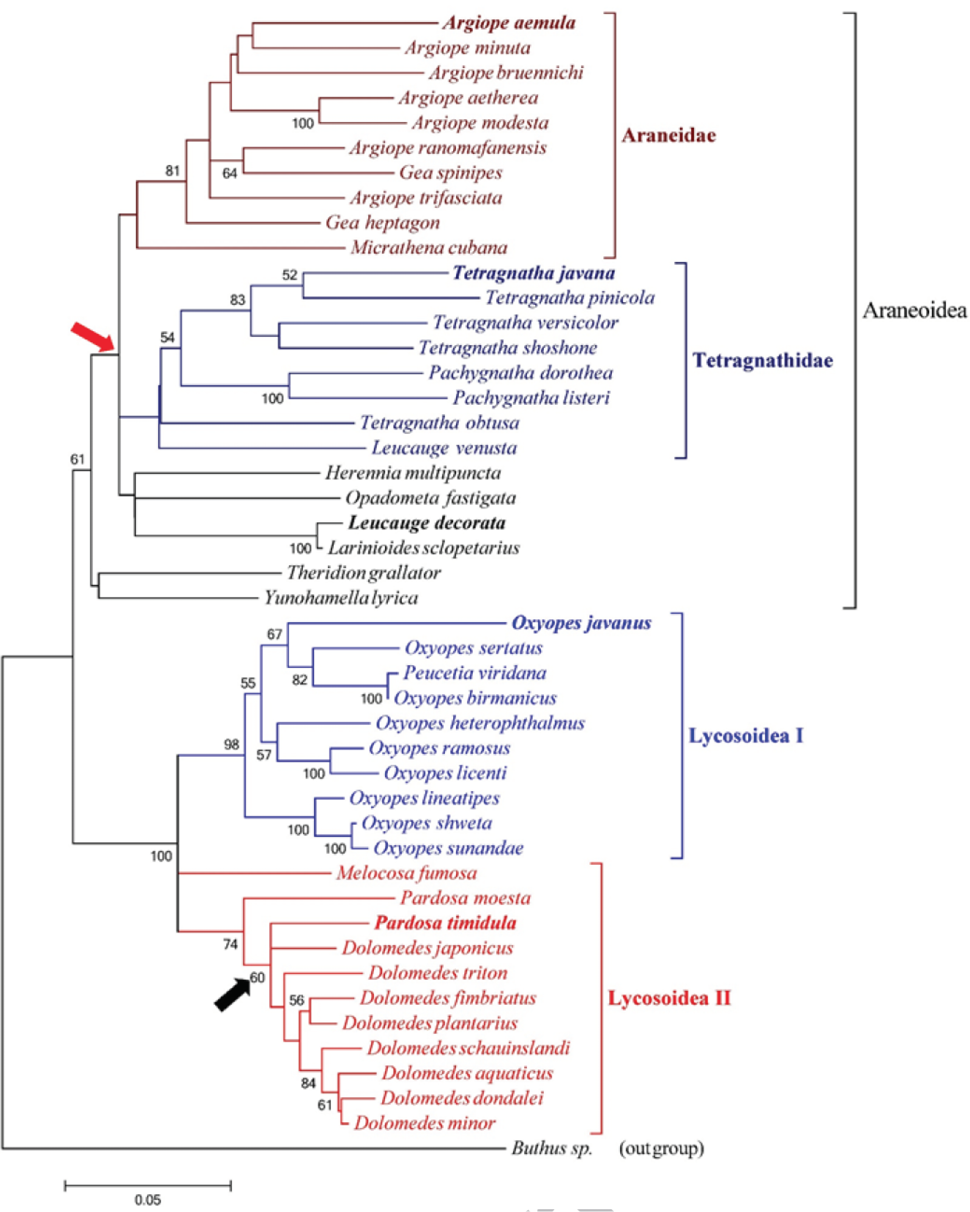
Fig. 2.
Molecular phylogenetic analysis of Cytochrome C Oxidase subunit 1 from selected spider species. The tree was rooted with Buthus sp. as an out-group. The scale bar represents the sequence divergence. Bootstrap values (100 replicates) are shown at the nodes.