
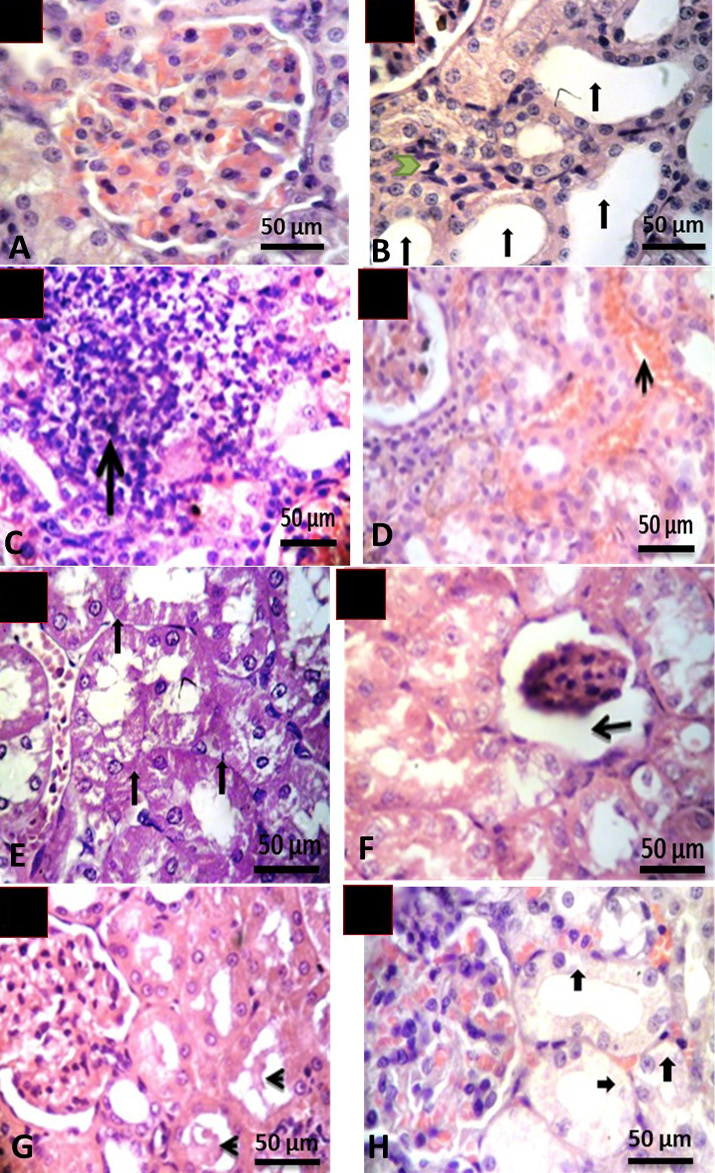
Fig. 1.
Histological structure of kidney of rat A, control group showing normal renal tissues; B-F, irradiated groups: B shows dilated renal tubules (↑) and leukocyte infiltration (→); C shows replacement of the tubules with leukocytes infiltration (↑); D shows congested intertubular blood vessels (↑); E showes necrosis of tubules with loss of its details (↑); F shows atrophy of glomeruli and increasing the capsular space (←) with loss brush border of renal tubules; G shows hyaline cast inside renal tubules (←); H shows hydropic degeneration in some distal convoluted tubules (↑). Magnification= 400X, Stain, H & E.