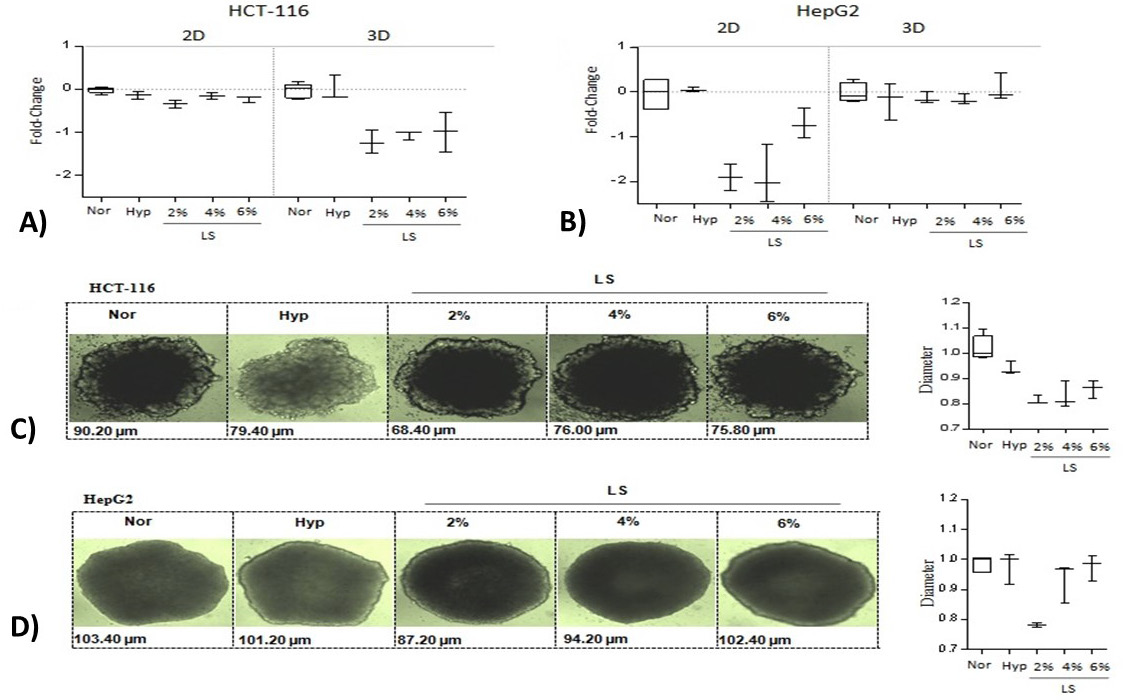
Impact of metabolic stress on cell proliferation rates in 2D and 3D cell culture systems. (A) HCT-116 and (B) HepG2 cells were cultivated (seeding density; 3x10⁴ cells) in 2D and 3D cell culture systems under normal growth conditions (10% FBS; 20% Oxygen), hypoxia (10% FBS; 0% Oxygen) or low-serum growth conditions (2, 4, or 6% FBS; 20% Oxygen). DNA/protein quantification assays were performed to determine cell number. Data were normalized to normal conditions and LOG2 transformed. Data are representative of three independent experiments. Representative microscopy images of (C) HCT-116 and (D) HepG2 spheroids generated in aforementioned culture conditions. The panels on the right compare diameters of the corresponding cell line spheroids. Data were normalized with median of the normal condition.
(Abbreviations: Nor, normal growth conditions; Hyp, hypoxia; LS, low-serum growth conditions).