
Figure 2
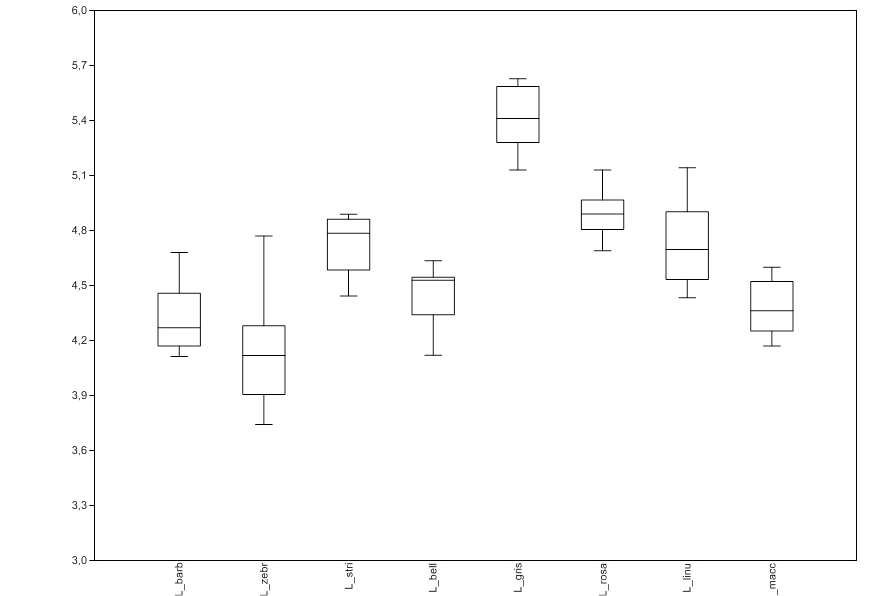
Box plot showing the average of centroid size based on ventral configurations of each species. Box margin are the 25th and 75th percentiles, bars extend to 5th and 95th percentiles, the inner line represents the median.
Box plot showing the average of centroid size based on ventral configurations of each species. Box margin are the 25th and 75th percentiles, bars extend to 5th and 95th percentiles, the inner line represents the median.