Fig. 2.
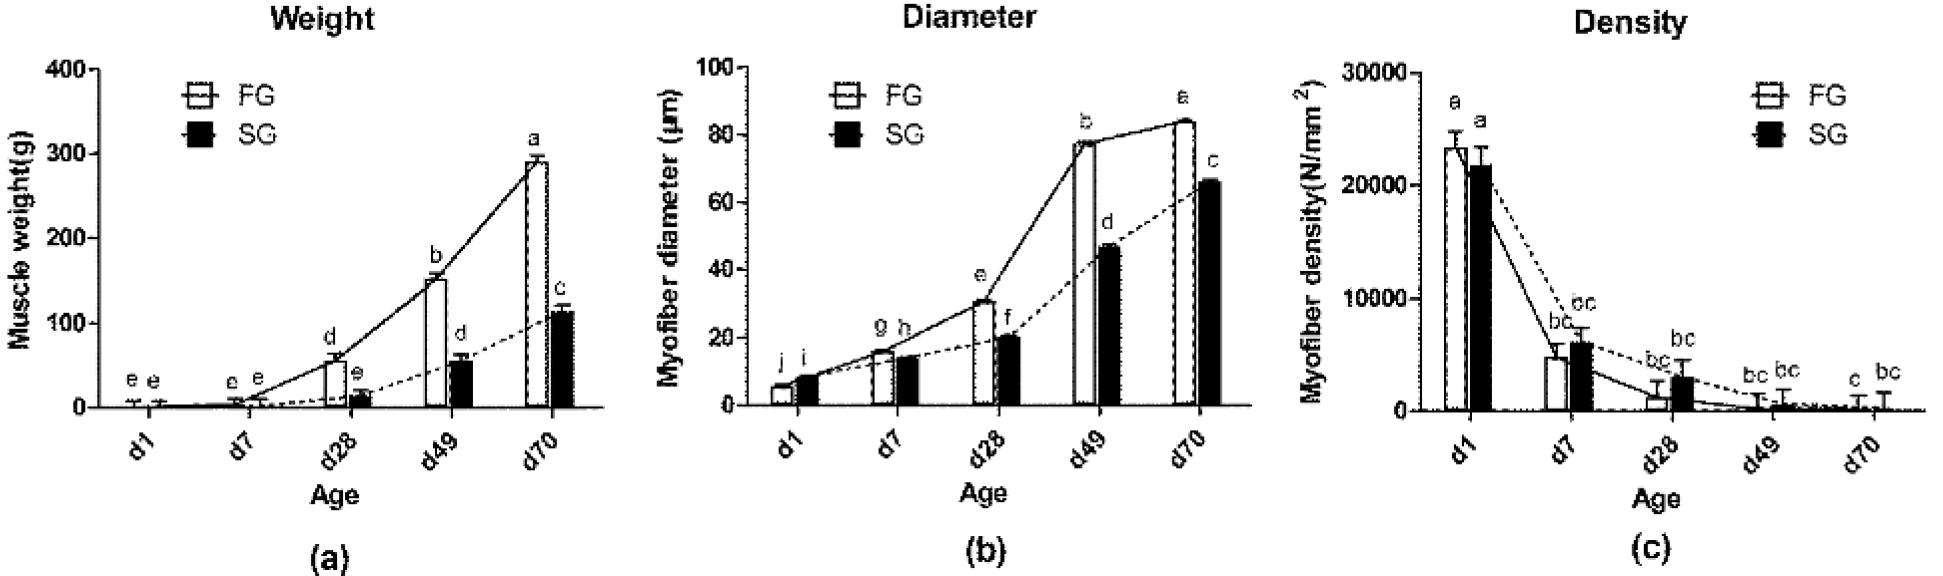
Myofiber characteristics of populations FG and SG on d 1, 7, 28, 49, and 70. (a) Muscle weight, (b) myofiber diameter, (c) myofiber density. Means without a common lowercase differ significantly (P < 0.05).
Myofiber characteristics of populations FG and SG on d 1, 7, 28, 49, and 70. (a) Muscle weight, (b) myofiber diameter, (c) myofiber density. Means without a common lowercase differ significantly (P < 0.05).