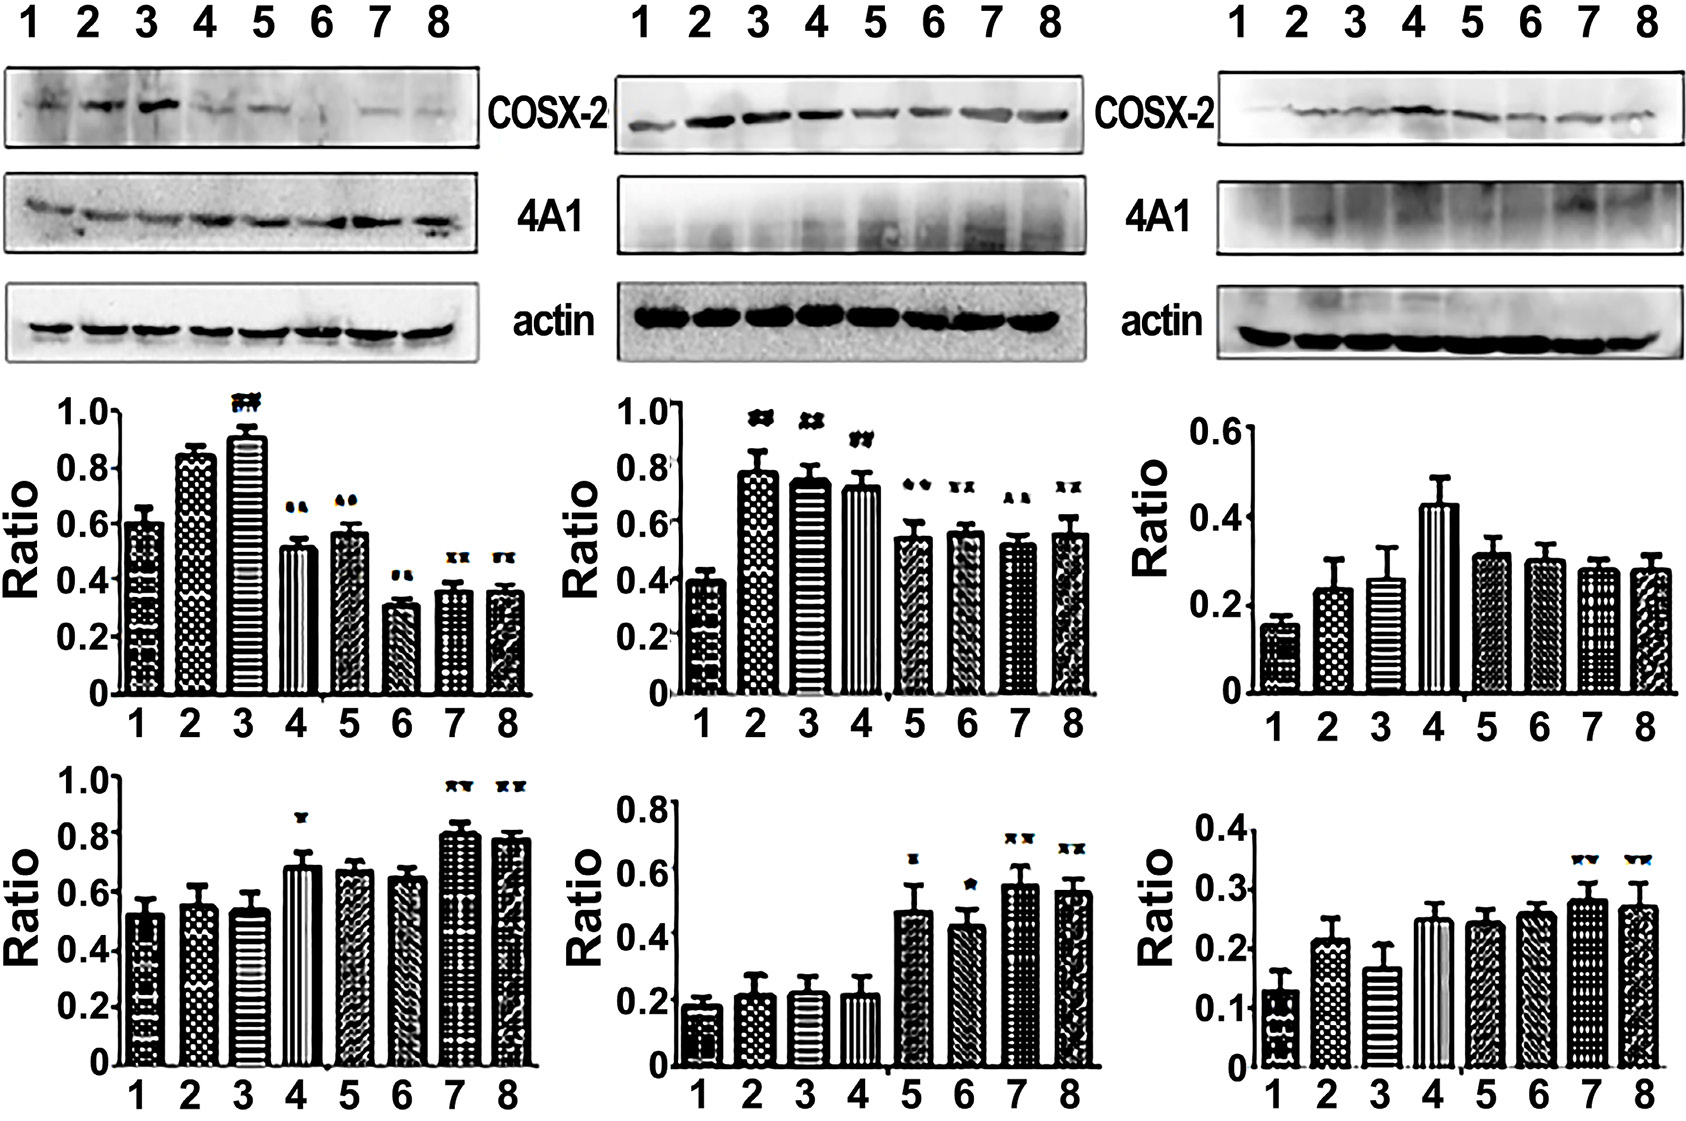
Fig. 5.
Effect of drug combination on the protein of CYP4A1, COX-2 in the experimental groups (A) Kidney. (B) Heart. (C) Liver. Data are the mean ± SD. #P<0.05, ##P<0.01 compare with control group; *P<0.05, **P<0.01 compare with model group.