
Fig. 4.
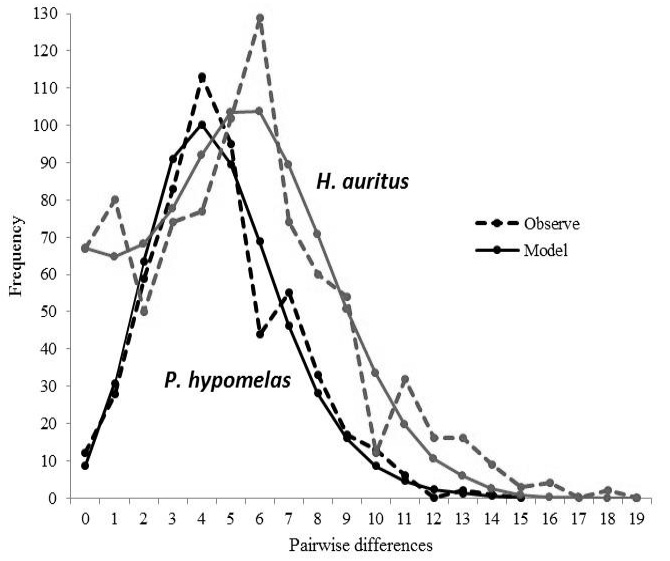
The observed pairwise mismatch distribution of mtDNA (cyt b) in H. auritus (black) and P. hypomelas (red) as compared to the expected distribution based on a model of population expansion.
The observed pairwise mismatch distribution of mtDNA (cyt b) in H. auritus (black) and P. hypomelas (red) as compared to the expected distribution based on a model of population expansion.