
Figure 1
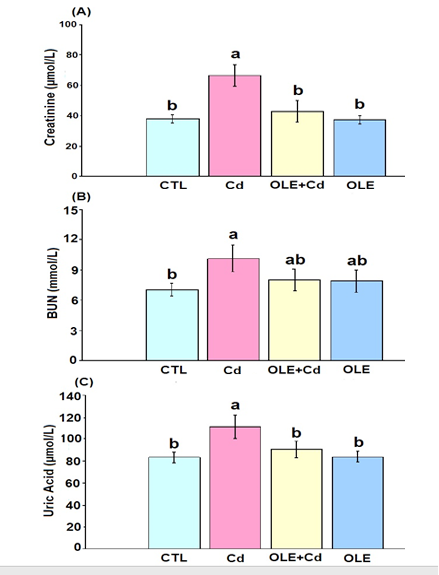
Serum concentrations of creatinine, blood urea nitrogen (BUN) and uric acid were shown in Fig. 1A, B and C, respectively. Four groups were assigned for different treatment throughout 6 weeks as; G1: Control (CTL), G2: Cd, G3: Olive leaves’ extract plus Cd (OLE+Cd), G4: OLE. All data were expressed as mean ± SD for 10 animals (n=10). Letters on bars (a, b, ab) denote significance difference at P<0.05.