
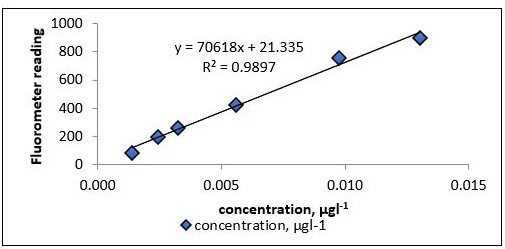
Figure 2:
Standard curve of fluorescence concentration.
Note: Mean followed by similar letter in the same column are not significantly different after Tukey’s multiple test at 95% confidence level. Number in brackets are the percentage reduction of bagworm (%) on selected DAT.