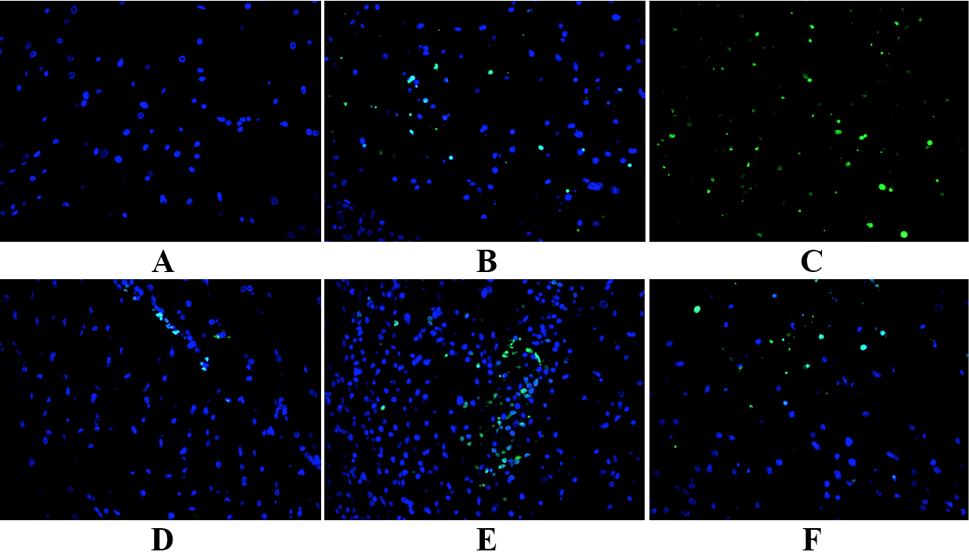
Fig. 1.
Effect of XN on neuronal apoptosis in hemorrhagic brain tissue of ICH rats. Under the fluorescence microscope, blue represents cell nuclei, green intensity represents apoptotic cells in the blank group (A), sham-operated group (B), model group (C), AGNH group (D) and XN-treated (low/high doses, E/F) groups. The two patterns were superimposed to determine the apoptosis. All images were taken at 400× magnification.