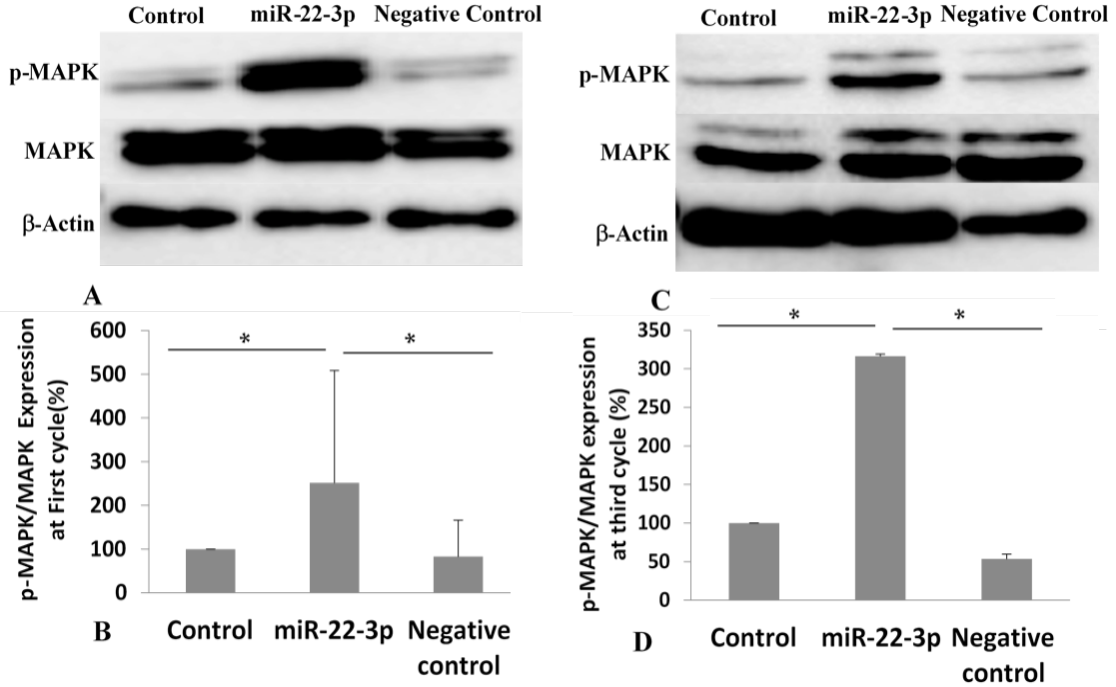
Fig. 4.
Representative immunoblots showing expression of β -actin, total MAPK and phosphorylated MAPK along with graph of p-MAPK/MAPK relative expression. A, B, In the first cycle of differentiation to adipocytes, the immunoblots show an upregulation of p-MAPK in miR-22-3p transfected cells in comparison to control and negative control groups. C, D, Representative immunoblots and graph following the third cycle of differentiation. The results also indicate an upregulation of p-MAPK at this stage. Experiments were performed in triplicates and the average percentage values were calculated. The data is presented as mean ± S.D * p < 0.05, versus control and negative control groups.