
Figure 2
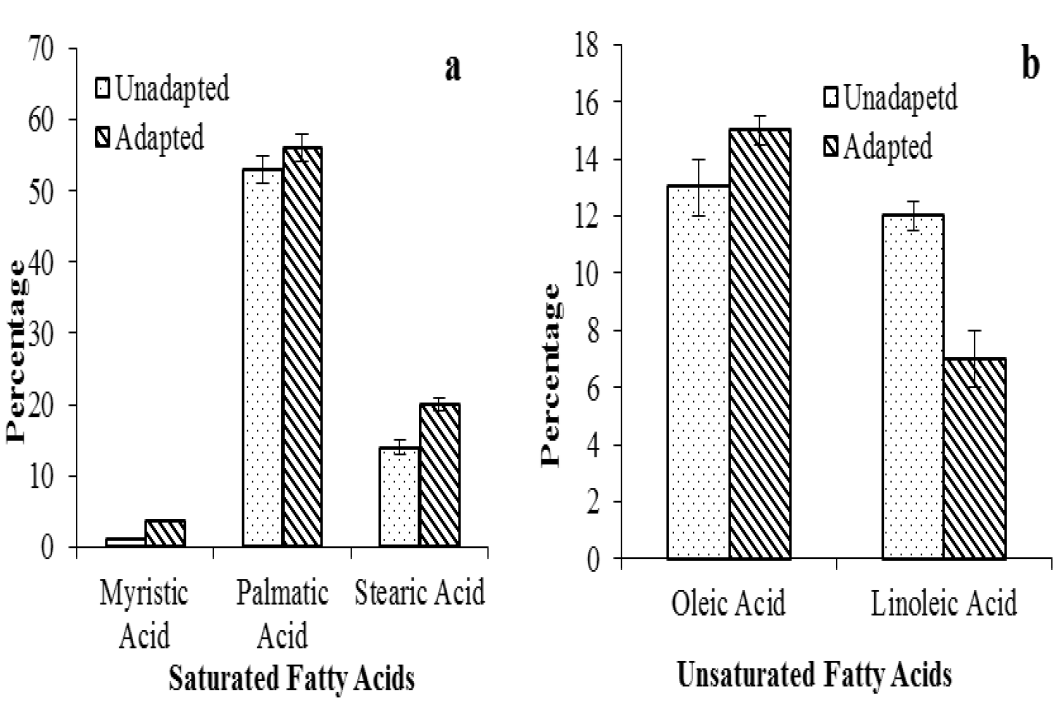
Fatty Acid profile of unadapted and adapted cell lines of rice. (a) saturated fatty acids, (b) unsaturated fatty acids. The bars represent the mean values of 5 replicates +SE.
Fatty Acid profile of unadapted and adapted cell lines of rice. (a) saturated fatty acids, (b) unsaturated fatty acids. The bars represent the mean values of 5 replicates +SE.