
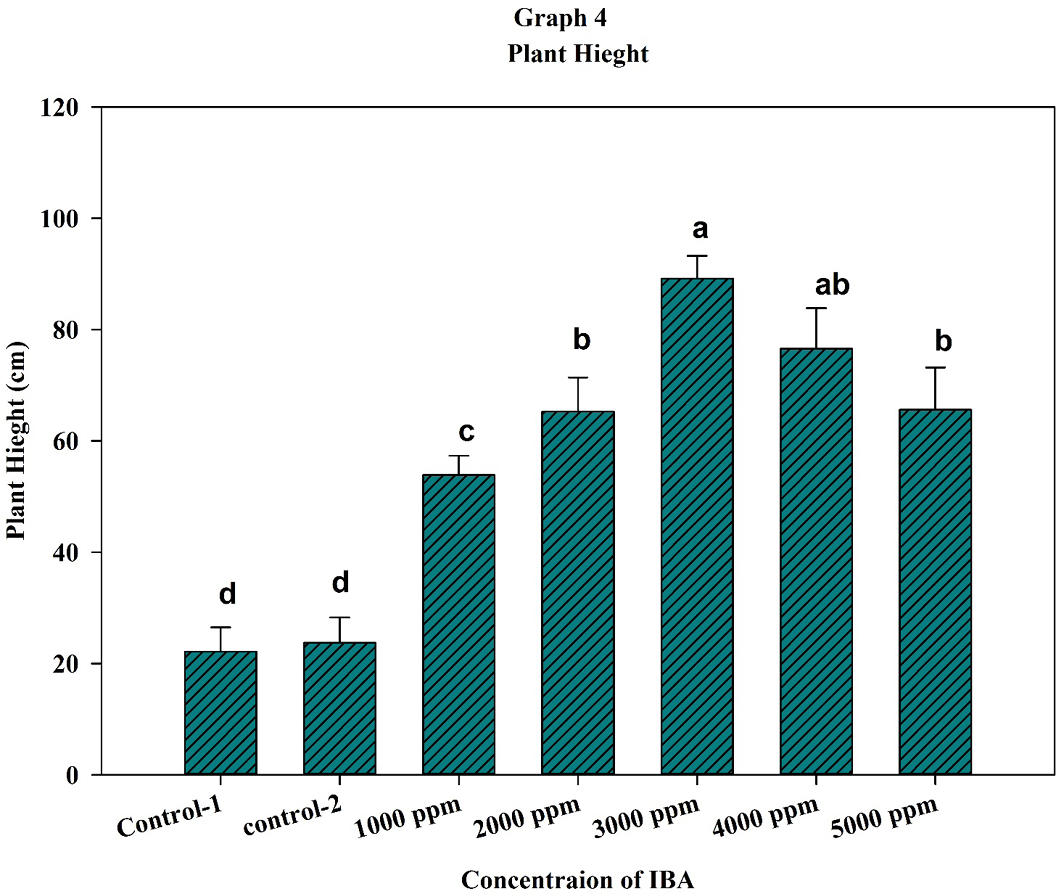
Figure 4
Plant Height (PH cm %) as effected by different concentrations of IBA; The data for SSR% were statistically highly significant according to analysis of variance Table 1. Means with different alphabetic letters indicate statistically significant differences according to Least Significant Differences (LSD) test (P< 0.05).