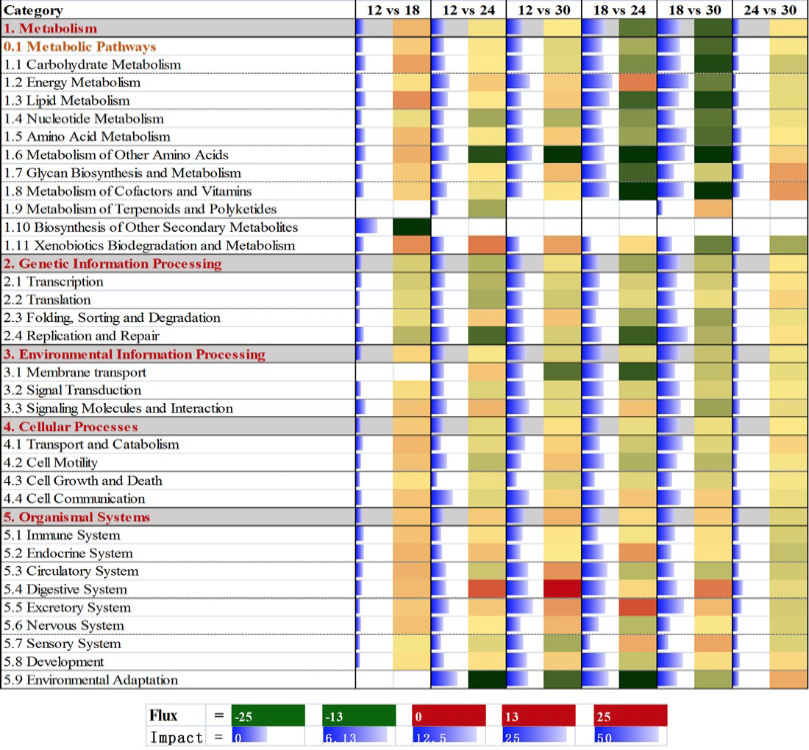
Fig. 1.
Results of flux and impact uncovered by the dynamic impact approach (DIA) based on Kyoto Encyclopedia of Genes and Genomes (KEGG) Pathways database analysis of the bovine muscle transcriptome for each time comparison. Notes: Blue lines show the impact of each category and the corresponding subcategories (P value<0.05 and no fold change). The impact is represented by the horizontal blue bars (large the bar larger the impact). Flux represents the direction of each category and the corresponding subcategory (green color, inhibition; yellow, stable; red color, activation, with different color intensities according to the level of up-regulation or down-regulation).