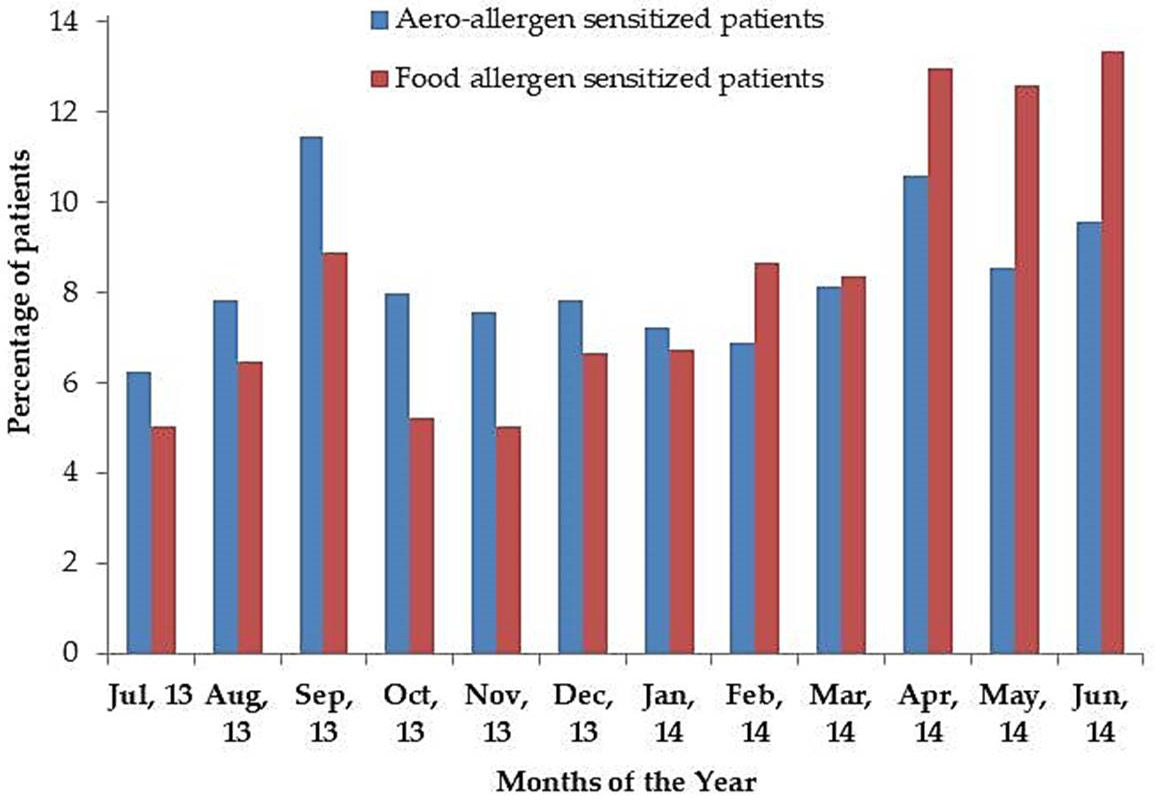
Fig. 8.
Seasonal (month wise) distribution of aero and food allergen sensitized patients during the study period. Percentages of aero-allergen sensitized patients: Jul-13, 6.26%; Aug-13, 7.83%; Sep-13, 11.46%; Oct-13, 7.98%; Nov-13, 7.59%; Dec-13, 7.82%; Jan-14, 7.24%; Feb-14, 6.89%; Mar-14, 8.14%; Apr-14, 10.58%; May-14, 8.56%; Jun-14, 9.59%. Percentages of food-allergen sensitized patients: Jul-13, 5.04%; Aug-13, 6.49%; Sep-13, 8.89%; Oct-13, 5.21%; Nov-13, 5.04%; Dec-13, 6.65%; Jan-14, 6.75%; Feb-14, 8.66%; Mar-14, 8.35%; Apr-14, 12.98%; May-14, 12.59%; Jun-14, 13.35%.